from lokigi.site import SiteProblem
import pandas as pdConsidering equity in our solutions
problem = SiteProblem()
problem.add_demand("../../../sample_data/brighton_demand.csv", demand_col="demand", location_id_col="LSOA")
problem.add_sites("../../../sample_data/brighton_sites_existing.geojson", candidate_id_col="site")
problem.add_travel_matrix(
    travel_matrix_df="../../../sample_data/brighton_travel_matrix_driving.csv",
    source_col="LSOA",
    from_unit="seconds",
    to_unit="minutes"
    )
problem.add_region_geometry_layer(
    "https://github.com/hsma-programme/h6_3d_facility_location_problems/raw/refs/heads/main/h6_3d_facility_location_problems/example_code/LSOA_2011_Boundaries_Super_Generalised_Clipped_BSC_EW_V4.geojson",
    common_col="LSOA11NM"
    )
This time, we will add a new set of equity data.
Before we add it to our problem, let’s load in our equity dataset normally and have a look at it.
This dataset has come from the UK government open geography portal and is licenced under the open government licence. You can take a look at it here.
equity_df = pd.read_csv("../../../sample_data/Index_of_Multiple_Deprivation_(Dec_2015)_Lookup_in_England.csv")

equity_df.head()| ObjectId | LSOA11CD | LSOA11NM | IMD15 | |
|---|---|---|---|---|
| 0 | 1 | E01021988 | Tendring 018A | 1 |
| 1 | 2 | E01012673 | Blackpool 010A | 2 |
| 2 | 3 | E01012681 | Blackpool 006A | 3 |
| 3 | 4 | E01024657 | Thanet 001A | 4 |
| 4 | 5 | E01012751 | Blackpool 013D | 5 |
equity_df.tail()| ObjectId | LSOA11CD | LSOA11NM | IMD15 | |
|---|---|---|---|---|
| 32839 | 32840 | E01028400 | Rushcliffe 008D | 32840 |
| 32840 | 32841 | E01022863 | Hart 007B | 32841 |
| 32841 | 32842 | E01016695 | Wokingham 002F | 32842 |
| 32842 | 32843 | E01016676 | Wokingham 001B | 32843 |
| 32843 | 32844 | E01016709 | Wokingham 020E | 32844 |
It looks like the IMD15 ranks every single LSOA. That’s fine - we can ask lokigi to turn it into deciles for us!
We know that in this dataset, 1 = most deprived and 32844 = least deprived, so we set reverse=False (which is the default).
problem.add_equity_data(
    "../../../sample_data/Index_of_Multiple_Deprivation_(Dec_2015)_Lookup_in_England.csv",
    equity_col="IMD15",
    common_col="LSOA11NM",
    label="Indices of Multiple Deprivation",
    continuous_measure=True,
    reverse=False
    )
Let’s see what our dataset looks like after loading it in.
problem.show_equity_data()| LSOA11NM | IMD15 | IMD15_raw | |
|---|---|---|---|
| 0 | Tendring 018A | 1 | 1 |
| 1 | Blackpool 010A | 1 | 2 |
| 2 | Blackpool 006A | 1 | 3 |
| 3 | Thanet 001A | 1 | 4 |
| 4 | Blackpool 013D | 1 | 5 |
| ... | ... | ... | ... |
| 32839 | Rushcliffe 008D | 10 | 32840 |
| 32840 | Hart 007B | 10 | 32841 |
| 32841 | Wokingham 002F | 10 | 32842 |
| 32842 | Wokingham 001B | 10 | 32843 |
| 32843 | Wokingham 020E | 10 | 32844 |
32844 rows × 3 columns
We can see we have the original column, but also a new column that has classified this data into deciles.
Let’s now plot this using our .plot_region_geometry_layer() method. We’ll set plot_equity to True.
problem.plot_region_geometry_layer(plot_equity=True, linewidth=0.03)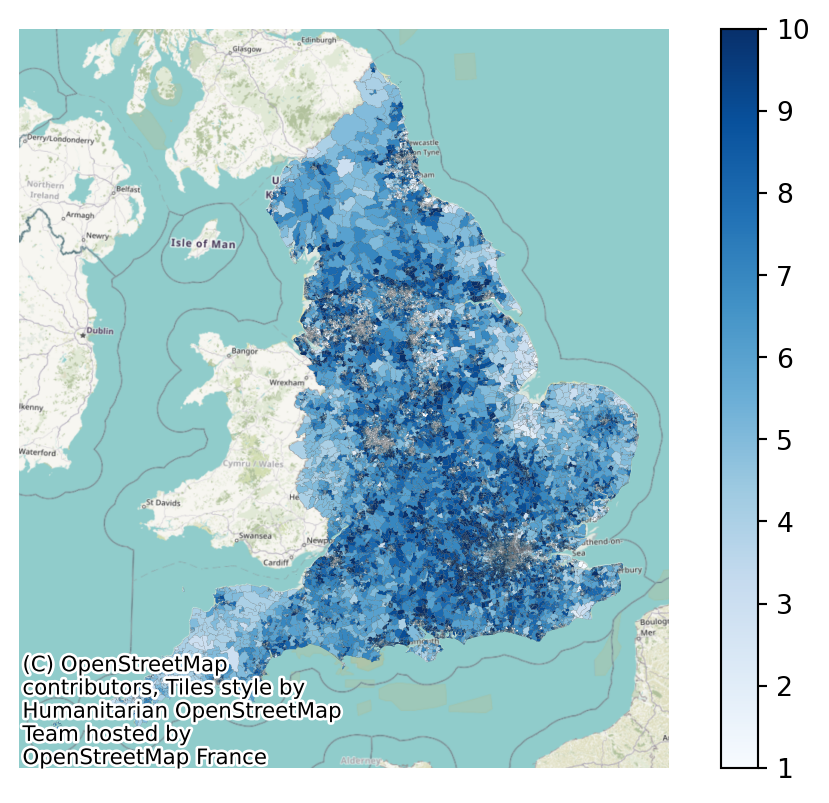
However, this is not that useful to us as it’s very zoomed out and showing the whole dataset (as our region geometry layer is for the whole of England too).
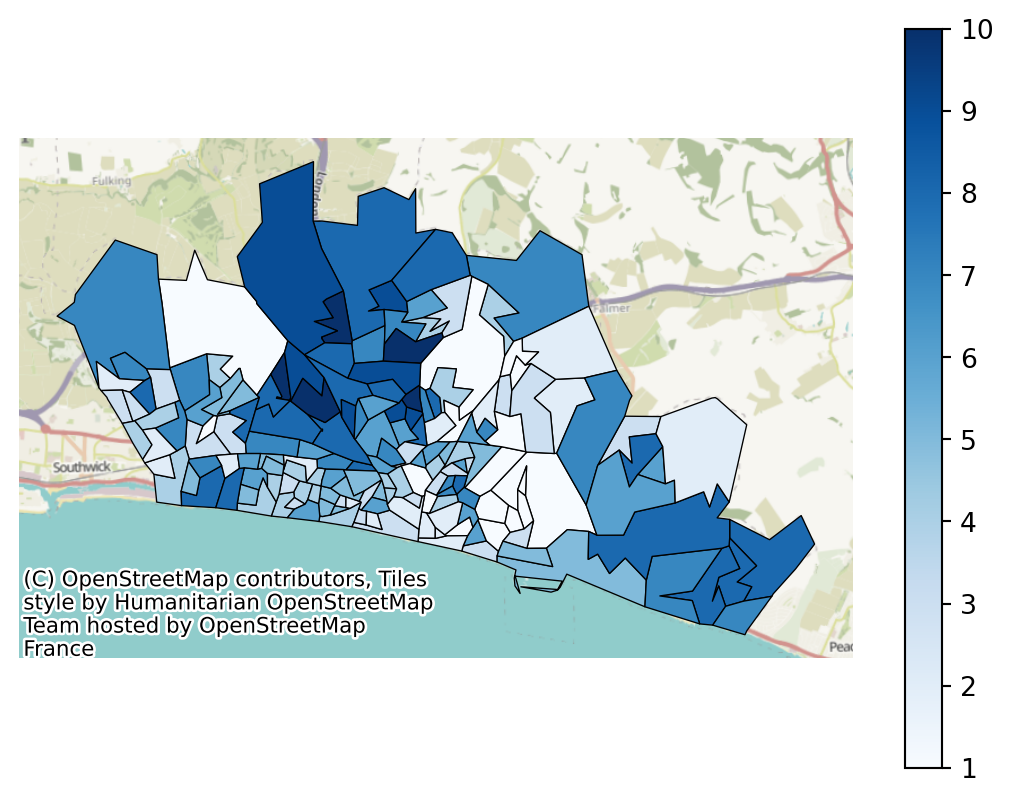
However, we have passed in demand data for only our region of interest, so if we set ‘plot_region_of_interest_only’ to True, it will limit the output plot to that region.
problem.plot_region_geometry_layer(
    plot_equity=True,
    plot_region_of_interest_only=True
    )
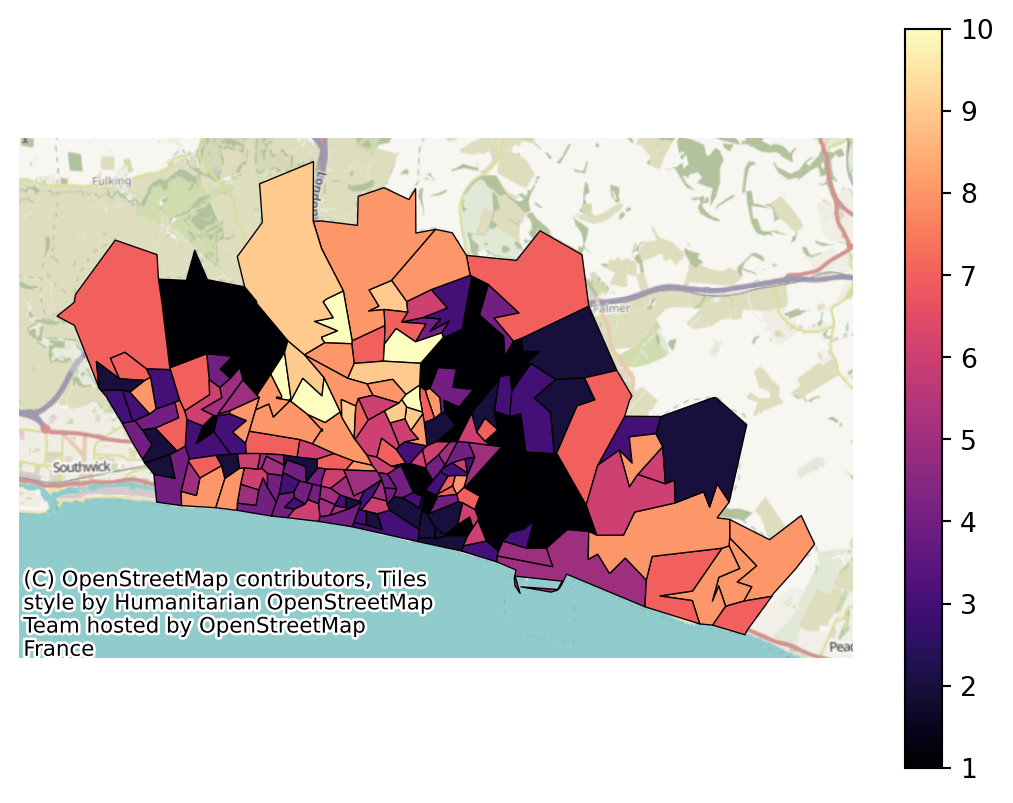
We can change the colourmap to something else.
problem.plot_region_geometry_layer(
    plot_equity=True,
    plot_region_of_interest_only=True,
    cmap="magma"
    )
We can also opt to plot it in an interactive format instead.
problem.plot_region_geometry_layer(
    plot_equity=True,
    plot_region_of_interest_only=True,
    interactive=True
    )
Make this Notebook Trusted to load map: File -> Trust Notebook
Let’s now solve the problem.
solutions = problem.solve(p=4, objectives="p_median", threshold_for_coverage=10)
solutions.show_solutions()| solution_rank | site_names | site_indices | unselected_site_names | coverage_threshold | weighted_average | unweighted_average | 90th_percentile | max | weighted_average_for_ranking | ... | gap_absolute_weighted | gap_relative_weighted | avg_lower_third_bins | avg_middle_third_bins | avg_upper_third_bins | inter_tertile_ratio | gap_absolute_description | gap_relative_description | inter_tertile_description | problem_df | |
|---|---|---|---|---|---|---|---|---|---|---|---|---|---|---|---|---|---|---|---|---|---|
| 0 | 1 | [Site 1, Site 3, Site 4, Site 5] | [0, 2, 3, 4] | [Site 2, Site 6] | 10 | 5.08 | 5.12 | 7.82 | 16.69 | 5.08 | ... | 2.63 | 1.72 | 5.50 | 4.53 | 5.54 | 0.99 | Spread of 2.6 minutes between best and worst g... | Significant Disparity (Worst group travels 72%... | Balanced (Macro travel times are broadly equal) | LSOA Site 1 Sit... |
| 1 | 2 | [Site 3, Site 4, Site 5, Site 6] | [2, 3, 4, 5] | [Site 1, Site 2] | 10 | 5.11 | 5.05 | 7.42 | 16.69 | 5.11 | ... | 2.44 | 1.66 | 5.54 | 4.64 | 4.55 | 1.22 | Spread of 2.4 minutes between best and worst g... | Significant Disparity (Worst group travels 66%... | Slightly Inequitable (Most deprived travel 22%... | LSOA Site 3 Sit... |
| 2 | 3 | [Site 2, Site 3, Site 4, Site 6] | [1, 2, 3, 5] | [Site 1, Site 5] | 10 | 5.20 | 5.07 | 7.75 | 16.69 | 5.20 | ... | 2.75 | 1.76 | 5.71 | 4.65 | 4.42 | 1.29 | Spread of 2.8 minutes between best and worst g... | Significant Disparity (Worst group travels 76%... | Highly Inequitable (Most deprived travel 29% l... | LSOA Site 2 Sit... |
| 3 | 4 | [Site 1, Site 2, Site 3, Site 4] | [0, 1, 2, 3] | [Site 5, Site 6] | 10 | 5.22 | 5.21 | 8.34 | 16.69 | 5.22 | ... | 2.80 | 1.77 | 5.70 | 4.61 | 5.61 | 1.01 | Spread of 2.8 minutes between best and worst g... | Significant Disparity (Worst group travels 77%... | Balanced (Macro travel times are broadly equal) | LSOA Site 1 Sit... |
| 4 | 5 | [Site 1, Site 3, Site 4, Site 6] | [0, 2, 3, 5] | [Site 2, Site 5] | 10 | 5.23 | 5.19 | 8.06 | 16.69 | 5.23 | ... | 2.76 | 1.76 | 5.66 | 4.69 | 5.50 | 1.03 | Spread of 2.8 minutes between best and worst g... | Significant Disparity (Worst group travels 76%... | Balanced (Macro travel times are broadly equal) | LSOA Site 1 Sit... |
| 5 | 6 | [Site 2, Site 3, Site 4, Site 5] | [1, 2, 3, 4] | [Site 1, Site 6] | 10 | 5.28 | 5.33 | 8.32 | 16.69 | 5.28 | ... | 2.10 | 1.49 | 5.67 | 4.81 | 5.46 | 1.04 | Spread of 2.1 minutes between best and worst g... | Significant Disparity (Worst group travels 49%... | Balanced (Macro travel times are broadly equal) | LSOA Site 2 Sit... |
| 6 | 7 | [Site 1, Site 3, Site 5, Site 6] | [0, 2, 4, 5] | [Site 2, Site 4] | 10 | 6.05 | 5.90 | 9.07 | 16.69 | 6.05 | ... | 3.29 | 1.88 | 6.13 | 5.98 | 4.65 | 1.32 | Spread of 3.3 minutes between best and worst g... | Significant Disparity (Worst group travels 88%... | Highly Inequitable (Most deprived travel 32% l... | LSOA Site 1 Sit... |
| 7 | 8 | [Site 1, Site 2, Site 3, Site 6] | [0, 1, 2, 5] | [Site 4, Site 5] | 10 | 6.14 | 5.92 | 9.33 | 16.69 | 6.14 | ... | 3.60 | 1.99 | 6.29 | 6.00 | 4.52 | 1.39 | Spread of 3.6 minutes between best and worst g... | Significant Disparity (Worst group travels 99%... | Highly Inequitable (Most deprived travel 39% l... | LSOA Site 1 Sit... |
| 8 | 9 | [Site 1, Site 2, Site 3, Site 5] | [0, 1, 2, 4] | [Site 4, Site 6] | 10 | 6.24 | 6.17 | 9.69 | 16.69 | 6.24 | ... | 2.65 | 1.58 | 6.26 | 6.16 | 5.49 | 1.14 | Spread of 2.7 minutes between best and worst g... | Significant Disparity (Worst group travels 58%... | Slightly Inequitable (Most deprived travel 14%... | LSOA Site 1 Sit... |
| 9 | 10 | [Site 2, Site 3, Site 5, Site 6] | [1, 2, 4, 5] | [Site 1, Site 4] | 10 | 6.33 | 6.17 | 9.26 | 16.69 | 6.33 | ... | 3.74 | 2.09 | 6.33 | 6.36 | 4.49 | 1.41 | Spread of 3.7 minutes between best and worst g... | Significant Disparity (Worst group travels 109... | Highly Inequitable (Most deprived travel 41% l... | LSOA Site 2 Sit... |
| 10 | 11 | [Site 1, Site 2, Site 4, Site 5] | [0, 1, 3, 4] | [Site 3, Site 6] | 10 | 6.63 | 6.43 | 11.32 | 21.71 | 6.63 | ... | 4.23 | 1.97 | 7.68 | 5.63 | 5.71 | 1.35 | Spread of 4.2 minutes between best and worst g... | Significant Disparity (Worst group travels 97%... | Highly Inequitable (Most deprived travel 35% l... | LSOA Site 1 Sit... |
| 11 | 12 | [Site 2, Site 4, Site 5, Site 6] | [1, 3, 4, 5] | [Site 1, Site 3] | 10 | 6.66 | 6.37 | 11.32 | 21.71 | 6.66 | ... | 5.34 | 2.55 | 7.72 | 5.74 | 4.72 | 1.64 | Spread of 5.3 minutes between best and worst g... | Significant Disparity (Worst group travels 155... | Highly Inequitable (Most deprived travel 64% l... | LSOA Site 2 Sit... |
| 12 | 13 | [Site 1, Site 2, Site 4, Site 6] | [0, 1, 3, 5] | [Site 3, Site 5] | 10 | 6.83 | 6.48 | 11.58 | 22.86 | 6.83 | ... | 5.49 | 2.52 | 8.05 | 5.73 | 4.92 | 1.63 | Spread of 5.5 minutes between best and worst g... | Significant Disparity (Worst group travels 152... | Highly Inequitable (Most deprived travel 63% l... | LSOA Site 1 Sit... |
| 13 | 14 | [Site 1, Site 4, Site 5, Site 6] | [0, 3, 4, 5] | [Site 2, Site 3] | 10 | 6.91 | 6.56 | 12.26 | 21.71 | 6.91 | ... | 5.68 | 2.53 | 8.06 | 5.91 | 4.98 | 1.62 | Spread of 5.7 minutes between best and worst g... | Significant Disparity (Worst group travels 153... | Highly Inequitable (Most deprived travel 62% l... | LSOA Site 1 Sit... |
| 14 | 15 | [Site 1, Site 2, Site 5, Site 6] | [0, 1, 4, 5] | [Site 3, Site 4] | 10 | 7.67 | 7.27 | 11.67 | 21.71 | 7.67 | ... | 5.34 | 2.55 | 8.43 | 7.10 | 4.82 | 1.75 | Spread of 5.3 minutes between best and worst g... | Significant Disparity (Worst group travels 155... | Highly Inequitable (Most deprived travel 75% l... | LSOA Site 1 Sit... |
15 rows × 37 columns
The equity verdict columns above (gap_absolute_description, gap_relative_description, inter_tertile_description) are plain-English sentences, but pandas’ default display truncates any string column wider than 50 characters with “…”, so they get cut off mid-sentence in the raw table above. show_solutions_summary() surfaces the same verdicts as a few named columns instead; setting display.max_colwidth once keeps them from being cut off.
pd.set_option("display.max_colwidth", None)  # so long text columns aren't cut off with "..."

solutions.show_solutions_summary()[[
    "Equity gap (mins, best vs worst group)",
    "Equity verdict (best vs worst group)",
    "Equity verdict (most vs least deprived third)",
]]| Equity gap (mins, best vs worst group) | Equity verdict (best vs worst group) | Equity verdict (most vs least deprived third) | |
|---|---|---|---|
| 0 | 2.6 | Significant Disparity (Worst group travels 72% longer) | Balanced (Macro travel times are broadly equal) |
| 1 | 2.4 | Significant Disparity (Worst group travels 66% longer) | Slightly Inequitable (Most deprived travel 22% longer) |
| 2 | 2.8 | Significant Disparity (Worst group travels 76% longer) | Highly Inequitable (Most deprived travel 29% longer) |
| 3 | 2.8 | Significant Disparity (Worst group travels 77% longer) | Balanced (Macro travel times are broadly equal) |
| 4 | 2.8 | Significant Disparity (Worst group travels 76% longer) | Balanced (Macro travel times are broadly equal) |
| 5 | 2.1 | Significant Disparity (Worst group travels 49% longer) | Balanced (Macro travel times are broadly equal) |
| 6 | 3.3 | Significant Disparity (Worst group travels 88% longer) | Highly Inequitable (Most deprived travel 32% longer) |
| 7 | 3.6 | Significant Disparity (Worst group travels 99% longer) | Highly Inequitable (Most deprived travel 39% longer) |
| 8 | 2.7 | Significant Disparity (Worst group travels 58% longer) | Slightly Inequitable (Most deprived travel 14% longer) |
| 9 | 3.7 | Significant Disparity (Worst group travels 109% longer) | Highly Inequitable (Most deprived travel 41% longer) |
| 10 | 4.2 | Significant Disparity (Worst group travels 97% longer) | Highly Inequitable (Most deprived travel 35% longer) |
| 11 | 5.3 | Significant Disparity (Worst group travels 155% longer) | Highly Inequitable (Most deprived travel 64% longer) |
| 12 | 5.5 | Significant Disparity (Worst group travels 152% longer) | Highly Inequitable (Most deprived travel 63% longer) |
| 13 | 5.7 | Significant Disparity (Worst group travels 153% longer) | Highly Inequitable (Most deprived travel 62% longer) |
| 14 | 5.3 | Significant Disparity (Worst group travels 155% longer) | Highly Inequitable (Most deprived travel 75% longer) |
inter_tertile_ratio is a single number hovering around 1, and its direction has to be reasoned about every time (“is lower better here?”). What it summarises – how average travel time moves as you walk from the most-deprived third of bands to the least – is a shape, and plot_equity_tertiles() draws exactly that shape: bars for every band, ordered most- to least-disadvantaged, with the two thirds the ratio actually divides highlighted and their own averages drawn across them.
solutions.plot_equity_tertiles()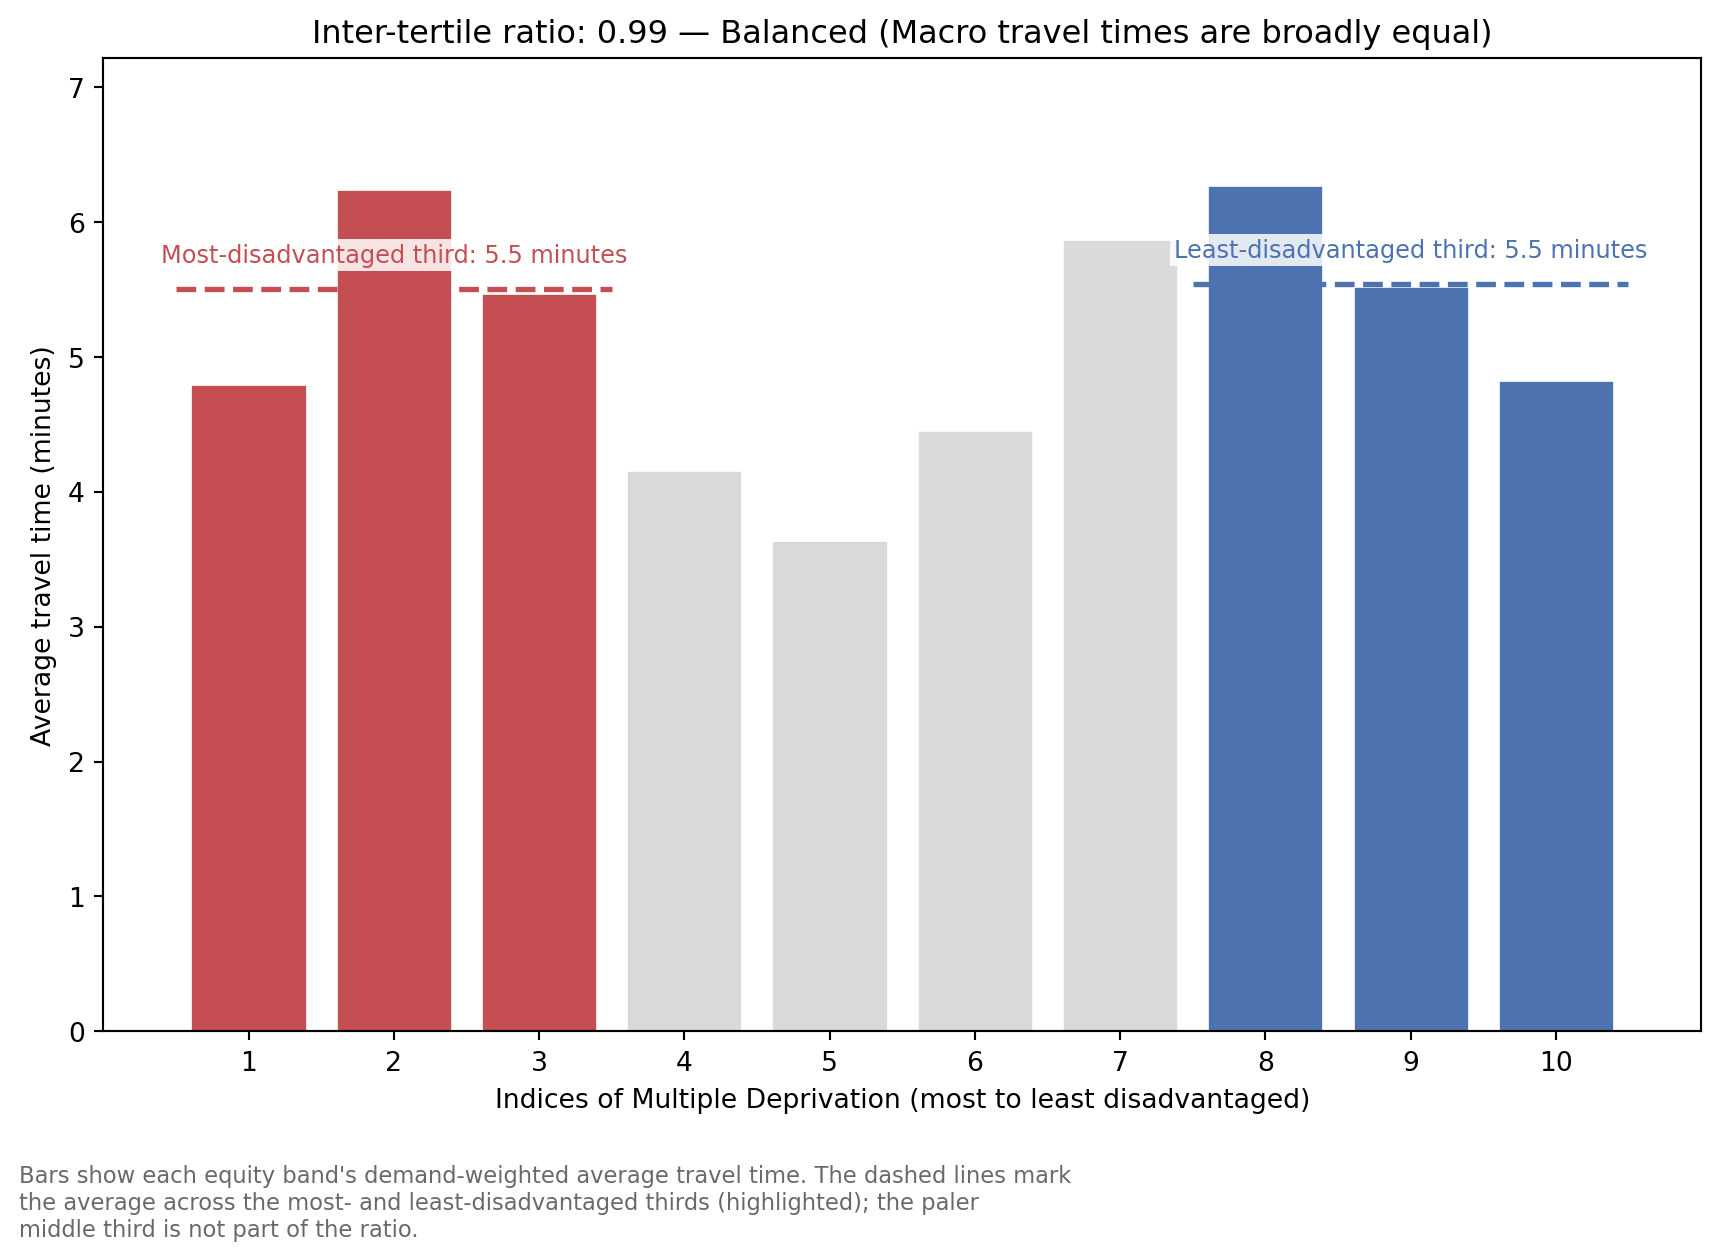
By default this uses the demand-weighted mean travel time per band (weighted_by_equity_group), the same figure inter_tertile_ratio is built from. That is deliberately a different default to check_solution_equity() (below), which plots the plain (unweighted) mean – every region counting equally regardless of demand. The two can differ materially, so pass weighted=False if you want the numbers to match check_solution_equity() instead.
solutions.plot_equity_tertiles(weighted=False)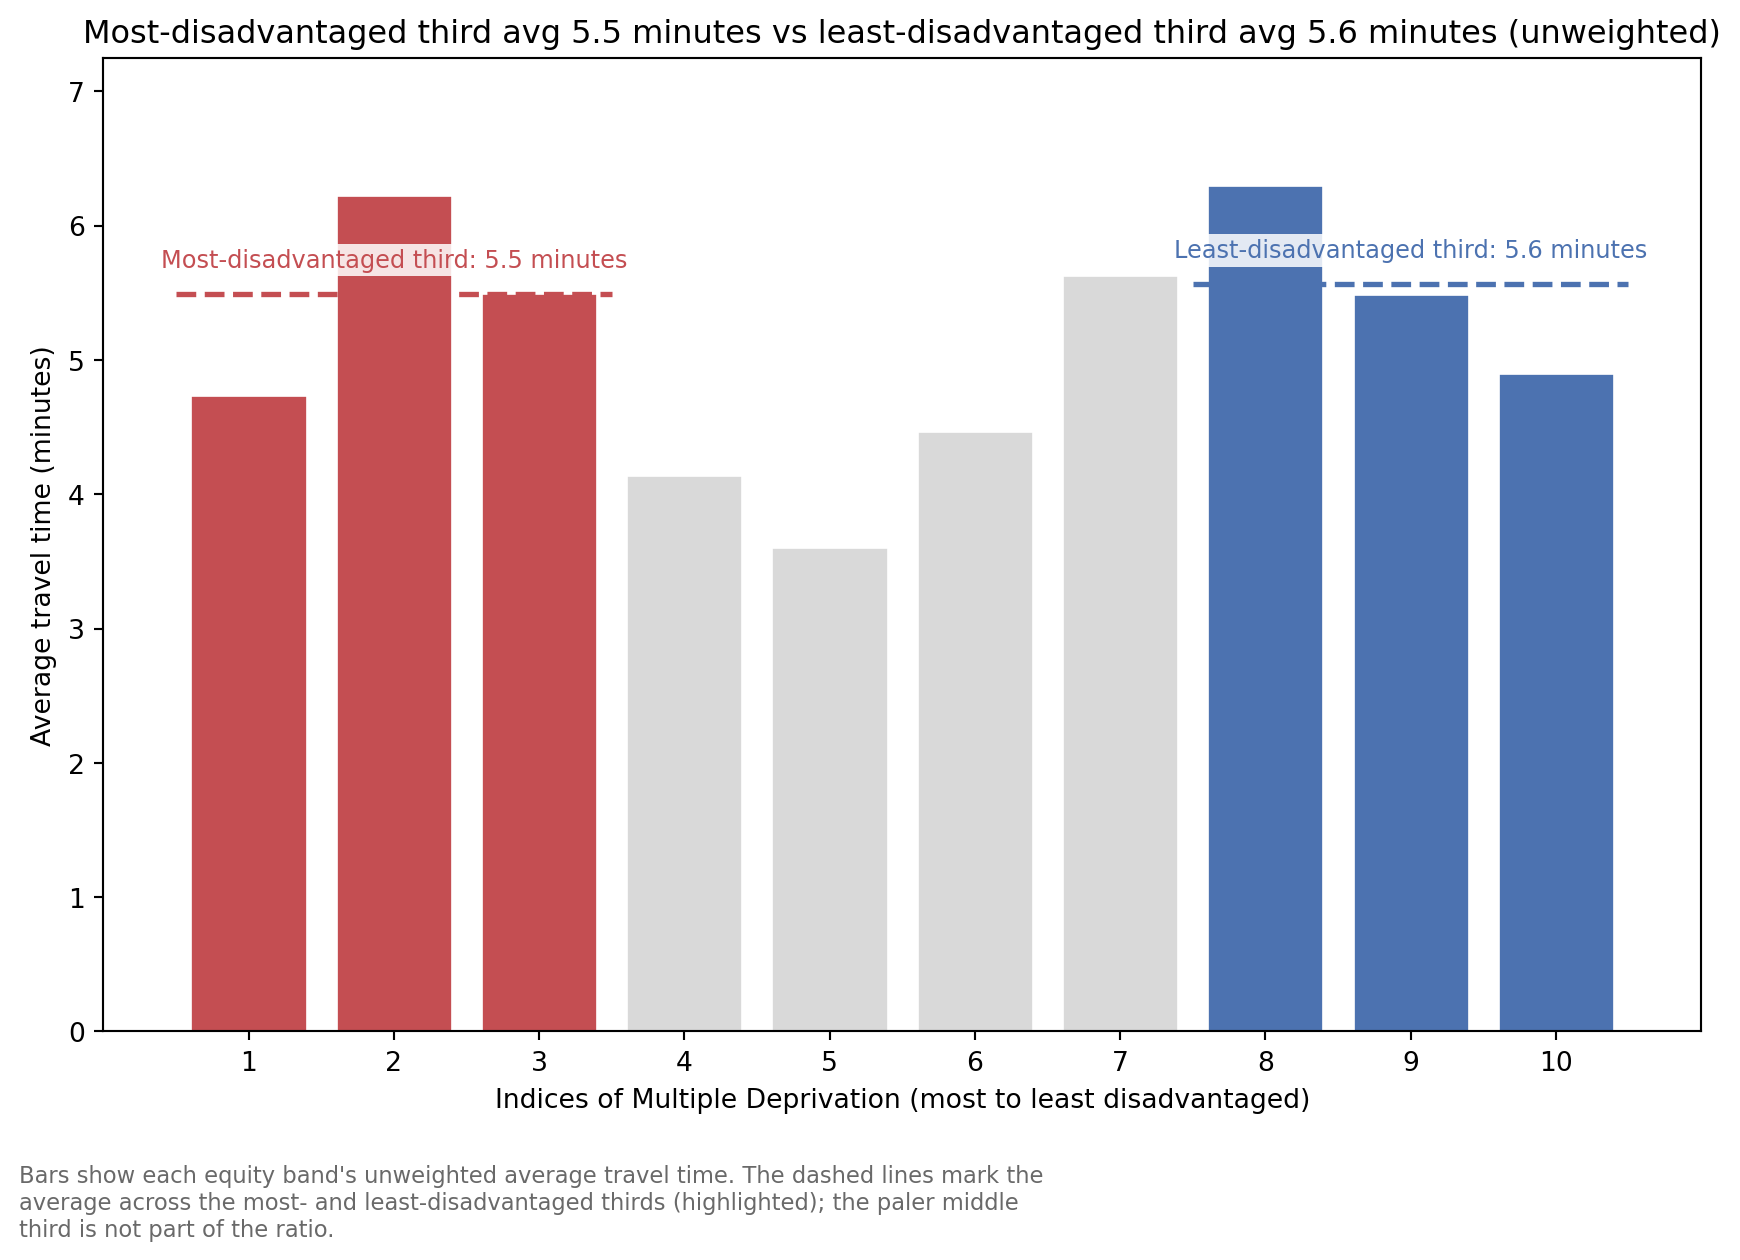
Notice above that some columns – weighted_by_equity_group, unweighted_by_equity_group, coverage_by_equity_group, and max_cost_by_equity_group – hold a dict per solution, one entry per equity group. That is compact, but it is awkward to work with: you cannot sort, filter, or export it directly, and it will not survive a round-trip through CSV.
coverage_by_equity_group is demand-weighted, like its headline sibling proportion_within_coverage_threshold – there’s also a coverage_regions_by_equity_group counterpart that counts regions equally instead. See the regional vs. demand-weighted coverage example for how the two can differ.
show_solutions() can expand these into their own columns instead, named <column>__<group>, via expand_dict_columns=True.
solutions.show_solutions(expand_dict_columns=True)| solution_rank | site_names | site_indices | unselected_site_names | coverage_threshold | weighted_average | unweighted_average | 90th_percentile | max | weighted_average_for_ranking | ... | gap_absolute_weighted | gap_relative_weighted | avg_lower_third_bins | avg_middle_third_bins | avg_upper_third_bins | inter_tertile_ratio | gap_absolute_description | gap_relative_description | inter_tertile_description | problem_df | |
|---|---|---|---|---|---|---|---|---|---|---|---|---|---|---|---|---|---|---|---|---|---|
| 0 | 1 | [Site 1, Site 3, Site 4, Site 5] | [0, 2, 3, 4] | [Site 2, Site 6] | 10 | 5.08 | 5.12 | 7.82 | 16.69 | 5.08 | ... | 2.63 | 1.72 | 5.50 | 4.53 | 5.54 | 0.99 | Spread of 2.6 minutes between best and worst groups | Significant Disparity (Worst group travels 72% longer) | Balanced (Macro travel times are broadly equal) | LSOA Site 1 Site 3 Site 4 Site 5 \ 0 Brighton and Hove 027E 12.898833 7.404833 8.197500 10.125667 1 Brighton and Hove 027F 12.623167 8.626167 9.351167 9.649500 2 Brighton and Hove 027A 12.720667 8.633000 6.840000 11.353833 3 Brighton and Hove 029E 12.393667 11.006000 6.328667 12.193000 4 Brighton and Hove 029D 11.097500 10.970000 5.216667 12.408333 .. ... ... ... ... ... 160 Brighton and Hove 012A 7.442333 18.468500 8.652667 10.433667 161 Brighton and Hove 005C 7.830000 16.804000 9.490000 8.769167 162 Brighton and Hove 012B 7.742167 18.876667 8.952500 10.841833 163 Brighton and Hove 005A 9.458167 18.432167 11.068500 10.397333 164 Brighton and Hove 005B 8.258333 17.232333 9.918333 9.197500 min_cost selected_site within_threshold demand LSOA11NM \ 0 7.404833 Site 3 True 3627 Brighton and Hove 027E 1 8.626167 Site 3 True 2323 Brighton and Hove 027F 2 6.840000 Site 4 True 2596 Brighton and Hove 027A 3 6.328667 Site 4 True 3132 Brighton and Hove 029E 4 5.216667 Site 4 True 2883 Brighton and Hove 029D .. ... ... ... ... ... 160 7.442333 Site 1 True 2497 Brighton and Hove 012A 161 7.830000 Site 1 True 2570 Brighton and Hove 005C 162 7.742167 Site 1 True 2051 Brighton and Hove 012B 163 9.458167 Site 1 True 1164 Brighton and Hove 005A 164 8.258333 Site 1 True 1097 Brighton and Hove 005B IMD15 IMD15_raw 0 2 5040 1 3 9104 2 3 7483 3 2 6218 4 3 7018 .. ... ... 160 3 8891 161 2 5951 162 3 8814 163 7 21094 164 7 20761 [165 rows x 12 columns] |
| 1 | 2 | [Site 3, Site 4, Site 5, Site 6] | [2, 3, 4, 5] | [Site 1, Site 2] | 10 | 5.11 | 5.05 | 7.42 | 16.69 | 5.11 | ... | 2.44 | 1.66 | 5.54 | 4.64 | 4.55 | 1.22 | Spread of 2.4 minutes between best and worst groups | Significant Disparity (Worst group travels 66% longer) | Slightly Inequitable (Most deprived travel 22% longer) | LSOA Site 3 Site 4 Site 5 Site 6 \ 0 Brighton and Hove 027E 7.404833 8.197500 10.125667 9.248500 1 Brighton and Hove 027F 8.626167 9.351167 9.649500 8.972833 2 Brighton and Hove 027A 8.633000 6.840000 11.353833 9.289167 3 Brighton and Hove 029E 11.006000 6.328667 12.193000 9.293000 4 Brighton and Hove 029D 10.970000 5.216667 12.408333 9.508500 .. ... ... ... ... ... 160 Brighton and Hove 012A 18.468500 8.652667 10.433667 7.463000 161 Brighton and Hove 005C 16.804000 9.490000 8.769167 5.798500 162 Brighton and Hove 012B 18.876667 8.952500 10.841833 7.871000 163 Brighton and Hove 005A 18.432167 11.068500 10.397333 7.426667 164 Brighton and Hove 005B 17.232333 9.918333 9.197500 6.226833 min_cost selected_site within_threshold demand LSOA11NM \ 0 7.404833 Site 3 True 3627 Brighton and Hove 027E 1 8.626167 Site 3 True 2323 Brighton and Hove 027F 2 6.840000 Site 4 True 2596 Brighton and Hove 027A 3 6.328667 Site 4 True 3132 Brighton and Hove 029E 4 5.216667 Site 4 True 2883 Brighton and Hove 029D .. ... ... ... ... ... 160 7.463000 Site 6 True 2497 Brighton and Hove 012A 161 5.798500 Site 6 True 2570 Brighton and Hove 005C 162 7.871000 Site 6 True 2051 Brighton and Hove 012B 163 7.426667 Site 6 True 1164 Brighton and Hove 005A 164 6.226833 Site 6 True 1097 Brighton and Hove 005B IMD15 IMD15_raw 0 2 5040 1 3 9104 2 3 7483 3 2 6218 4 3 7018 .. ... ... 160 3 8891 161 2 5951 162 3 8814 163 7 21094 164 7 20761 [165 rows x 12 columns] |
| 2 | 3 | [Site 2, Site 3, Site 4, Site 6] | [1, 2, 3, 5] | [Site 1, Site 5] | 10 | 5.20 | 5.07 | 7.75 | 16.69 | 5.20 | ... | 2.75 | 1.76 | 5.71 | 4.65 | 4.42 | 1.29 | Spread of 2.8 minutes between best and worst groups | Significant Disparity (Worst group travels 76% longer) | Highly Inequitable (Most deprived travel 29% longer) | LSOA Site 2 Site 3 Site 4 Site 6 \ 0 Brighton and Hove 027E 8.794833 7.404833 8.197500 9.248500 1 Brighton and Hove 027F 8.318500 8.626167 9.351167 8.972833 2 Brighton and Hove 027A 10.023000 8.633000 6.840000 9.289167 3 Brighton and Hove 029E 10.862000 11.006000 6.328667 9.293000 4 Brighton and Hove 029D 11.077500 10.970000 5.216667 9.508500 .. ... ... ... ... ... 160 Brighton and Hove 012A 14.745000 18.468500 8.652667 7.463000 161 Brighton and Hove 005C 13.080500 16.804000 9.490000 5.798500 162 Brighton and Hove 012B 15.153000 18.876667 8.952500 7.871000 163 Brighton and Hove 005A 14.708667 18.432167 11.068500 7.426667 164 Brighton and Hove 005B 13.508833 17.232333 9.918333 6.226833 min_cost selected_site within_threshold demand LSOA11NM \ 0 7.404833 Site 3 True 3627 Brighton and Hove 027E 1 8.318500 Site 2 True 2323 Brighton and Hove 027F 2 6.840000 Site 4 True 2596 Brighton and Hove 027A 3 6.328667 Site 4 True 3132 Brighton and Hove 029E 4 5.216667 Site 4 True 2883 Brighton and Hove 029D .. ... ... ... ... ... 160 7.463000 Site 6 True 2497 Brighton and Hove 012A 161 5.798500 Site 6 True 2570 Brighton and Hove 005C 162 7.871000 Site 6 True 2051 Brighton and Hove 012B 163 7.426667 Site 6 True 1164 Brighton and Hove 005A 164 6.226833 Site 6 True 1097 Brighton and Hove 005B IMD15 IMD15_raw 0 2 5040 1 3 9104 2 3 7483 3 2 6218 4 3 7018 .. ... ... 160 3 8891 161 2 5951 162 3 8814 163 7 21094 164 7 20761 [165 rows x 12 columns] |
| 3 | 4 | [Site 1, Site 2, Site 3, Site 4] | [0, 1, 2, 3] | [Site 5, Site 6] | 10 | 5.22 | 5.21 | 8.34 | 16.69 | 5.22 | ... | 2.80 | 1.77 | 5.70 | 4.61 | 5.61 | 1.01 | Spread of 2.8 minutes between best and worst groups | Significant Disparity (Worst group travels 77% longer) | Balanced (Macro travel times are broadly equal) | LSOA Site 1 Site 2 Site 3 Site 4 \ 0 Brighton and Hove 027E 12.898833 8.794833 7.404833 8.197500 1 Brighton and Hove 027F 12.623167 8.318500 8.626167 9.351167 2 Brighton and Hove 027A 12.720667 10.023000 8.633000 6.840000 3 Brighton and Hove 029E 12.393667 10.862000 11.006000 6.328667 4 Brighton and Hove 029D 11.097500 11.077500 10.970000 5.216667 .. ... ... ... ... ... 160 Brighton and Hove 012A 7.442333 14.745000 18.468500 8.652667 161 Brighton and Hove 005C 7.830000 13.080500 16.804000 9.490000 162 Brighton and Hove 012B 7.742167 15.153000 18.876667 8.952500 163 Brighton and Hove 005A 9.458167 14.708667 18.432167 11.068500 164 Brighton and Hove 005B 8.258333 13.508833 17.232333 9.918333 min_cost selected_site within_threshold demand LSOA11NM \ 0 7.404833 Site 3 True 3627 Brighton and Hove 027E 1 8.318500 Site 2 True 2323 Brighton and Hove 027F 2 6.840000 Site 4 True 2596 Brighton and Hove 027A 3 6.328667 Site 4 True 3132 Brighton and Hove 029E 4 5.216667 Site 4 True 2883 Brighton and Hove 029D .. ... ... ... ... ... 160 7.442333 Site 1 True 2497 Brighton and Hove 012A 161 7.830000 Site 1 True 2570 Brighton and Hove 005C 162 7.742167 Site 1 True 2051 Brighton and Hove 012B 163 9.458167 Site 1 True 1164 Brighton and Hove 005A 164 8.258333 Site 1 True 1097 Brighton and Hove 005B IMD15 IMD15_raw 0 2 5040 1 3 9104 2 3 7483 3 2 6218 4 3 7018 .. ... ... 160 3 8891 161 2 5951 162 3 8814 163 7 21094 164 7 20761 [165 rows x 12 columns] |
| 4 | 5 | [Site 1, Site 3, Site 4, Site 6] | [0, 2, 3, 5] | [Site 2, Site 5] | 10 | 5.23 | 5.19 | 8.06 | 16.69 | 5.23 | ... | 2.76 | 1.76 | 5.66 | 4.69 | 5.50 | 1.03 | Spread of 2.8 minutes between best and worst groups | Significant Disparity (Worst group travels 76% longer) | Balanced (Macro travel times are broadly equal) | LSOA Site 1 Site 3 Site 4 Site 6 \ 0 Brighton and Hove 027E 12.898833 7.404833 8.197500 9.248500 1 Brighton and Hove 027F 12.623167 8.626167 9.351167 8.972833 2 Brighton and Hove 027A 12.720667 8.633000 6.840000 9.289167 3 Brighton and Hove 029E 12.393667 11.006000 6.328667 9.293000 4 Brighton and Hove 029D 11.097500 10.970000 5.216667 9.508500 .. ... ... ... ... ... 160 Brighton and Hove 012A 7.442333 18.468500 8.652667 7.463000 161 Brighton and Hove 005C 7.830000 16.804000 9.490000 5.798500 162 Brighton and Hove 012B 7.742167 18.876667 8.952500 7.871000 163 Brighton and Hove 005A 9.458167 18.432167 11.068500 7.426667 164 Brighton and Hove 005B 8.258333 17.232333 9.918333 6.226833 min_cost selected_site within_threshold demand LSOA11NM \ 0 7.404833 Site 3 True 3627 Brighton and Hove 027E 1 8.626167 Site 3 True 2323 Brighton and Hove 027F 2 6.840000 Site 4 True 2596 Brighton and Hove 027A 3 6.328667 Site 4 True 3132 Brighton and Hove 029E 4 5.216667 Site 4 True 2883 Brighton and Hove 029D .. ... ... ... ... ... 160 7.442333 Site 1 True 2497 Brighton and Hove 012A 161 5.798500 Site 6 True 2570 Brighton and Hove 005C 162 7.742167 Site 1 True 2051 Brighton and Hove 012B 163 7.426667 Site 6 True 1164 Brighton and Hove 005A 164 6.226833 Site 6 True 1097 Brighton and Hove 005B IMD15 IMD15_raw 0 2 5040 1 3 9104 2 3 7483 3 2 6218 4 3 7018 .. ... ... 160 3 8891 161 2 5951 162 3 8814 163 7 21094 164 7 20761 [165 rows x 12 columns] |
| 5 | 6 | [Site 2, Site 3, Site 4, Site 5] | [1, 2, 3, 4] | [Site 1, Site 6] | 10 | 5.28 | 5.33 | 8.32 | 16.69 | 5.28 | ... | 2.10 | 1.49 | 5.67 | 4.81 | 5.46 | 1.04 | Spread of 2.1 minutes between best and worst groups | Significant Disparity (Worst group travels 49% longer) | Balanced (Macro travel times are broadly equal) | LSOA Site 2 Site 3 Site 4 Site 5 \ 0 Brighton and Hove 027E 8.794833 7.404833 8.197500 10.125667 1 Brighton and Hove 027F 8.318500 8.626167 9.351167 9.649500 2 Brighton and Hove 027A 10.023000 8.633000 6.840000 11.353833 3 Brighton and Hove 029E 10.862000 11.006000 6.328667 12.193000 4 Brighton and Hove 029D 11.077500 10.970000 5.216667 12.408333 .. ... ... ... ... ... 160 Brighton and Hove 012A 14.745000 18.468500 8.652667 10.433667 161 Brighton and Hove 005C 13.080500 16.804000 9.490000 8.769167 162 Brighton and Hove 012B 15.153000 18.876667 8.952500 10.841833 163 Brighton and Hove 005A 14.708667 18.432167 11.068500 10.397333 164 Brighton and Hove 005B 13.508833 17.232333 9.918333 9.197500 min_cost selected_site within_threshold demand \ 0 7.404833 Site 3 True 3627 1 8.318500 Site 2 True 2323 2 6.840000 Site 4 True 2596 3 6.328667 Site 4 True 3132 4 5.216667 Site 4 True 2883 .. ... ... ... ... 160 8.652667 Site 4 True 2497 161 8.769167 Site 5 True 2570 162 8.952500 Site 4 True 2051 163 10.397333 Site 5 False 1164 164 9.197500 Site 5 True 1097 LSOA11NM IMD15 IMD15_raw 0 Brighton and Hove 027E 2 5040 1 Brighton and Hove 027F 3 9104 2 Brighton and Hove 027A 3 7483 3 Brighton and Hove 029E 2 6218 4 Brighton and Hove 029D 3 7018 .. ... ... ... 160 Brighton and Hove 012A 3 8891 161 Brighton and Hove 005C 2 5951 162 Brighton and Hove 012B 3 8814 163 Brighton and Hove 005A 7 21094 164 Brighton and Hove 005B 7 20761 [165 rows x 12 columns] |
| 6 | 7 | [Site 1, Site 3, Site 5, Site 6] | [0, 2, 4, 5] | [Site 2, Site 4] | 10 | 6.05 | 5.90 | 9.07 | 16.69 | 6.05 | ... | 3.29 | 1.88 | 6.13 | 5.98 | 4.65 | 1.32 | Spread of 3.3 minutes between best and worst groups | Significant Disparity (Worst group travels 88% longer) | Highly Inequitable (Most deprived travel 32% longer) | LSOA Site 1 Site 3 Site 5 Site 6 \ 0 Brighton and Hove 027E 12.898833 7.404833 10.125667 9.248500 1 Brighton and Hove 027F 12.623167 8.626167 9.649500 8.972833 2 Brighton and Hove 027A 12.720667 8.633000 11.353833 9.289167 3 Brighton and Hove 029E 12.393667 11.006000 12.193000 9.293000 4 Brighton and Hove 029D 11.097500 10.970000 12.408333 9.508500 .. ... ... ... ... ... 160 Brighton and Hove 012A 7.442333 18.468500 10.433667 7.463000 161 Brighton and Hove 005C 7.830000 16.804000 8.769167 5.798500 162 Brighton and Hove 012B 7.742167 18.876667 10.841833 7.871000 163 Brighton and Hove 005A 9.458167 18.432167 10.397333 7.426667 164 Brighton and Hove 005B 8.258333 17.232333 9.197500 6.226833 min_cost selected_site within_threshold demand LSOA11NM \ 0 7.404833 Site 3 True 3627 Brighton and Hove 027E 1 8.626167 Site 3 True 2323 Brighton and Hove 027F 2 8.633000 Site 3 True 2596 Brighton and Hove 027A 3 9.293000 Site 6 True 3132 Brighton and Hove 029E 4 9.508500 Site 6 True 2883 Brighton and Hove 029D .. ... ... ... ... ... 160 7.442333 Site 1 True 2497 Brighton and Hove 012A 161 5.798500 Site 6 True 2570 Brighton and Hove 005C 162 7.742167 Site 1 True 2051 Brighton and Hove 012B 163 7.426667 Site 6 True 1164 Brighton and Hove 005A 164 6.226833 Site 6 True 1097 Brighton and Hove 005B IMD15 IMD15_raw 0 2 5040 1 3 9104 2 3 7483 3 2 6218 4 3 7018 .. ... ... 160 3 8891 161 2 5951 162 3 8814 163 7 21094 164 7 20761 [165 rows x 12 columns] |
| 7 | 8 | [Site 1, Site 2, Site 3, Site 6] | [0, 1, 2, 5] | [Site 4, Site 5] | 10 | 6.14 | 5.92 | 9.33 | 16.69 | 6.14 | ... | 3.60 | 1.99 | 6.29 | 6.00 | 4.52 | 1.39 | Spread of 3.6 minutes between best and worst groups | Significant Disparity (Worst group travels 99% longer) | Highly Inequitable (Most deprived travel 39% longer) | LSOA Site 1 Site 2 Site 3 Site 6 \ 0 Brighton and Hove 027E 12.898833 8.794833 7.404833 9.248500 1 Brighton and Hove 027F 12.623167 8.318500 8.626167 8.972833 2 Brighton and Hove 027A 12.720667 10.023000 8.633000 9.289167 3 Brighton and Hove 029E 12.393667 10.862000 11.006000 9.293000 4 Brighton and Hove 029D 11.097500 11.077500 10.970000 9.508500 .. ... ... ... ... ... 160 Brighton and Hove 012A 7.442333 14.745000 18.468500 7.463000 161 Brighton and Hove 005C 7.830000 13.080500 16.804000 5.798500 162 Brighton and Hove 012B 7.742167 15.153000 18.876667 7.871000 163 Brighton and Hove 005A 9.458167 14.708667 18.432167 7.426667 164 Brighton and Hove 005B 8.258333 13.508833 17.232333 6.226833 min_cost selected_site within_threshold demand LSOA11NM \ 0 7.404833 Site 3 True 3627 Brighton and Hove 027E 1 8.318500 Site 2 True 2323 Brighton and Hove 027F 2 8.633000 Site 3 True 2596 Brighton and Hove 027A 3 9.293000 Site 6 True 3132 Brighton and Hove 029E 4 9.508500 Site 6 True 2883 Brighton and Hove 029D .. ... ... ... ... ... 160 7.442333 Site 1 True 2497 Brighton and Hove 012A 161 5.798500 Site 6 True 2570 Brighton and Hove 005C 162 7.742167 Site 1 True 2051 Brighton and Hove 012B 163 7.426667 Site 6 True 1164 Brighton and Hove 005A 164 6.226833 Site 6 True 1097 Brighton and Hove 005B IMD15 IMD15_raw 0 2 5040 1 3 9104 2 3 7483 3 2 6218 4 3 7018 .. ... ... 160 3 8891 161 2 5951 162 3 8814 163 7 21094 164 7 20761 [165 rows x 12 columns] |
| 8 | 9 | [Site 1, Site 2, Site 3, Site 5] | [0, 1, 2, 4] | [Site 4, Site 6] | 10 | 6.24 | 6.17 | 9.69 | 16.69 | 6.24 | ... | 2.65 | 1.58 | 6.26 | 6.16 | 5.49 | 1.14 | Spread of 2.7 minutes between best and worst groups | Significant Disparity (Worst group travels 58% longer) | Slightly Inequitable (Most deprived travel 14% longer) | LSOA Site 1 Site 2 Site 3 Site 5 \ 0 Brighton and Hove 027E 12.898833 8.794833 7.404833 10.125667 1 Brighton and Hove 027F 12.623167 8.318500 8.626167 9.649500 2 Brighton and Hove 027A 12.720667 10.023000 8.633000 11.353833 3 Brighton and Hove 029E 12.393667 10.862000 11.006000 12.193000 4 Brighton and Hove 029D 11.097500 11.077500 10.970000 12.408333 .. ... ... ... ... ... 160 Brighton and Hove 012A 7.442333 14.745000 18.468500 10.433667 161 Brighton and Hove 005C 7.830000 13.080500 16.804000 8.769167 162 Brighton and Hove 012B 7.742167 15.153000 18.876667 10.841833 163 Brighton and Hove 005A 9.458167 14.708667 18.432167 10.397333 164 Brighton and Hove 005B 8.258333 13.508833 17.232333 9.197500 min_cost selected_site within_threshold demand \ 0 7.404833 Site 3 True 3627 1 8.318500 Site 2 True 2323 2 8.633000 Site 3 True 2596 3 10.862000 Site 2 False 3132 4 10.970000 Site 3 False 2883 .. ... ... ... ... 160 7.442333 Site 1 True 2497 161 7.830000 Site 1 True 2570 162 7.742167 Site 1 True 2051 163 9.458167 Site 1 True 1164 164 8.258333 Site 1 True 1097 LSOA11NM IMD15 IMD15_raw 0 Brighton and Hove 027E 2 5040 1 Brighton and Hove 027F 3 9104 2 Brighton and Hove 027A 3 7483 3 Brighton and Hove 029E 2 6218 4 Brighton and Hove 029D 3 7018 .. ... ... ... 160 Brighton and Hove 012A 3 8891 161 Brighton and Hove 005C 2 5951 162 Brighton and Hove 012B 3 8814 163 Brighton and Hove 005A 7 21094 164 Brighton and Hove 005B 7 20761 [165 rows x 12 columns] |
| 9 | 10 | [Site 2, Site 3, Site 5, Site 6] | [1, 2, 4, 5] | [Site 1, Site 4] | 10 | 6.33 | 6.17 | 9.26 | 16.69 | 6.33 | ... | 3.74 | 2.09 | 6.33 | 6.36 | 4.49 | 1.41 | Spread of 3.7 minutes between best and worst groups | Significant Disparity (Worst group travels 109% longer) | Highly Inequitable (Most deprived travel 41% longer) | LSOA Site 2 Site 3 Site 5 Site 6 \ 0 Brighton and Hove 027E 8.794833 7.404833 10.125667 9.248500 1 Brighton and Hove 027F 8.318500 8.626167 9.649500 8.972833 2 Brighton and Hove 027A 10.023000 8.633000 11.353833 9.289167 3 Brighton and Hove 029E 10.862000 11.006000 12.193000 9.293000 4 Brighton and Hove 029D 11.077500 10.970000 12.408333 9.508500 .. ... ... ... ... ... 160 Brighton and Hove 012A 14.745000 18.468500 10.433667 7.463000 161 Brighton and Hove 005C 13.080500 16.804000 8.769167 5.798500 162 Brighton and Hove 012B 15.153000 18.876667 10.841833 7.871000 163 Brighton and Hove 005A 14.708667 18.432167 10.397333 7.426667 164 Brighton and Hove 005B 13.508833 17.232333 9.197500 6.226833 min_cost selected_site within_threshold demand LSOA11NM \ 0 7.404833 Site 3 True 3627 Brighton and Hove 027E 1 8.318500 Site 2 True 2323 Brighton and Hove 027F 2 8.633000 Site 3 True 2596 Brighton and Hove 027A 3 9.293000 Site 6 True 3132 Brighton and Hove 029E 4 9.508500 Site 6 True 2883 Brighton and Hove 029D .. ... ... ... ... ... 160 7.463000 Site 6 True 2497 Brighton and Hove 012A 161 5.798500 Site 6 True 2570 Brighton and Hove 005C 162 7.871000 Site 6 True 2051 Brighton and Hove 012B 163 7.426667 Site 6 True 1164 Brighton and Hove 005A 164 6.226833 Site 6 True 1097 Brighton and Hove 005B IMD15 IMD15_raw 0 2 5040 1 3 9104 2 3 7483 3 2 6218 4 3 7018 .. ... ... 160 3 8891 161 2 5951 162 3 8814 163 7 21094 164 7 20761 [165 rows x 12 columns] |
| 10 | 11 | [Site 1, Site 2, Site 4, Site 5] | [0, 1, 3, 4] | [Site 3, Site 6] | 10 | 6.63 | 6.43 | 11.32 | 21.71 | 6.63 | ... | 4.23 | 1.97 | 7.68 | 5.63 | 5.71 | 1.35 | Spread of 4.2 minutes between best and worst groups | Significant Disparity (Worst group travels 97% longer) | Highly Inequitable (Most deprived travel 35% longer) | LSOA Site 1 Site 2 Site 4 Site 5 \ 0 Brighton and Hove 027E 12.898833 8.794833 8.197500 10.125667 1 Brighton and Hove 027F 12.623167 8.318500 9.351167 9.649500 2 Brighton and Hove 027A 12.720667 10.023000 6.840000 11.353833 3 Brighton and Hove 029E 12.393667 10.862000 6.328667 12.193000 4 Brighton and Hove 029D 11.097500 11.077500 5.216667 12.408333 .. ... ... ... ... ... 160 Brighton and Hove 012A 7.442333 14.745000 8.652667 10.433667 161 Brighton and Hove 005C 7.830000 13.080500 9.490000 8.769167 162 Brighton and Hove 012B 7.742167 15.153000 8.952500 10.841833 163 Brighton and Hove 005A 9.458167 14.708667 11.068500 10.397333 164 Brighton and Hove 005B 8.258333 13.508833 9.918333 9.197500 min_cost selected_site within_threshold demand LSOA11NM \ 0 8.197500 Site 4 True 3627 Brighton and Hove 027E 1 8.318500 Site 2 True 2323 Brighton and Hove 027F 2 6.840000 Site 4 True 2596 Brighton and Hove 027A 3 6.328667 Site 4 True 3132 Brighton and Hove 029E 4 5.216667 Site 4 True 2883 Brighton and Hove 029D .. ... ... ... ... ... 160 7.442333 Site 1 True 2497 Brighton and Hove 012A 161 7.830000 Site 1 True 2570 Brighton and Hove 005C 162 7.742167 Site 1 True 2051 Brighton and Hove 012B 163 9.458167 Site 1 True 1164 Brighton and Hove 005A 164 8.258333 Site 1 True 1097 Brighton and Hove 005B IMD15 IMD15_raw 0 2 5040 1 3 9104 2 3 7483 3 2 6218 4 3 7018 .. ... ... 160 3 8891 161 2 5951 162 3 8814 163 7 21094 164 7 20761 [165 rows x 12 columns] |
| 11 | 12 | [Site 2, Site 4, Site 5, Site 6] | [1, 3, 4, 5] | [Site 1, Site 3] | 10 | 6.66 | 6.37 | 11.32 | 21.71 | 6.66 | ... | 5.34 | 2.55 | 7.72 | 5.74 | 4.72 | 1.64 | Spread of 5.3 minutes between best and worst groups | Significant Disparity (Worst group travels 155% longer) | Highly Inequitable (Most deprived travel 64% longer) | LSOA Site 2 Site 4 Site 5 Site 6 \ 0 Brighton and Hove 027E 8.794833 8.197500 10.125667 9.248500 1 Brighton and Hove 027F 8.318500 9.351167 9.649500 8.972833 2 Brighton and Hove 027A 10.023000 6.840000 11.353833 9.289167 3 Brighton and Hove 029E 10.862000 6.328667 12.193000 9.293000 4 Brighton and Hove 029D 11.077500 5.216667 12.408333 9.508500 .. ... ... ... ... ... 160 Brighton and Hove 012A 14.745000 8.652667 10.433667 7.463000 161 Brighton and Hove 005C 13.080500 9.490000 8.769167 5.798500 162 Brighton and Hove 012B 15.153000 8.952500 10.841833 7.871000 163 Brighton and Hove 005A 14.708667 11.068500 10.397333 7.426667 164 Brighton and Hove 005B 13.508833 9.918333 9.197500 6.226833 min_cost selected_site within_threshold demand LSOA11NM \ 0 8.197500 Site 4 True 3627 Brighton and Hove 027E 1 8.318500 Site 2 True 2323 Brighton and Hove 027F 2 6.840000 Site 4 True 2596 Brighton and Hove 027A 3 6.328667 Site 4 True 3132 Brighton and Hove 029E 4 5.216667 Site 4 True 2883 Brighton and Hove 029D .. ... ... ... ... ... 160 7.463000 Site 6 True 2497 Brighton and Hove 012A 161 5.798500 Site 6 True 2570 Brighton and Hove 005C 162 7.871000 Site 6 True 2051 Brighton and Hove 012B 163 7.426667 Site 6 True 1164 Brighton and Hove 005A 164 6.226833 Site 6 True 1097 Brighton and Hove 005B IMD15 IMD15_raw 0 2 5040 1 3 9104 2 3 7483 3 2 6218 4 3 7018 .. ... ... 160 3 8891 161 2 5951 162 3 8814 163 7 21094 164 7 20761 [165 rows x 12 columns] |
| 12 | 13 | [Site 1, Site 2, Site 4, Site 6] | [0, 1, 3, 5] | [Site 3, Site 5] | 10 | 6.83 | 6.48 | 11.58 | 22.86 | 6.83 | ... | 5.49 | 2.52 | 8.05 | 5.73 | 4.92 | 1.63 | Spread of 5.5 minutes between best and worst groups | Significant Disparity (Worst group travels 152% longer) | Highly Inequitable (Most deprived travel 63% longer) | LSOA Site 1 Site 2 Site 4 Site 6 \ 0 Brighton and Hove 027E 12.898833 8.794833 8.197500 9.248500 1 Brighton and Hove 027F 12.623167 8.318500 9.351167 8.972833 2 Brighton and Hove 027A 12.720667 10.023000 6.840000 9.289167 3 Brighton and Hove 029E 12.393667 10.862000 6.328667 9.293000 4 Brighton and Hove 029D 11.097500 11.077500 5.216667 9.508500 .. ... ... ... ... ... 160 Brighton and Hove 012A 7.442333 14.745000 8.652667 7.463000 161 Brighton and Hove 005C 7.830000 13.080500 9.490000 5.798500 162 Brighton and Hove 012B 7.742167 15.153000 8.952500 7.871000 163 Brighton and Hove 005A 9.458167 14.708667 11.068500 7.426667 164 Brighton and Hove 005B 8.258333 13.508833 9.918333 6.226833 min_cost selected_site within_threshold demand LSOA11NM \ 0 8.197500 Site 4 True 3627 Brighton and Hove 027E 1 8.318500 Site 2 True 2323 Brighton and Hove 027F 2 6.840000 Site 4 True 2596 Brighton and Hove 027A 3 6.328667 Site 4 True 3132 Brighton and Hove 029E 4 5.216667 Site 4 True 2883 Brighton and Hove 029D .. ... ... ... ... ... 160 7.442333 Site 1 True 2497 Brighton and Hove 012A 161 5.798500 Site 6 True 2570 Brighton and Hove 005C 162 7.742167 Site 1 True 2051 Brighton and Hove 012B 163 7.426667 Site 6 True 1164 Brighton and Hove 005A 164 6.226833 Site 6 True 1097 Brighton and Hove 005B IMD15 IMD15_raw 0 2 5040 1 3 9104 2 3 7483 3 2 6218 4 3 7018 .. ... ... 160 3 8891 161 2 5951 162 3 8814 163 7 21094 164 7 20761 [165 rows x 12 columns] |
| 13 | 14 | [Site 1, Site 4, Site 5, Site 6] | [0, 3, 4, 5] | [Site 2, Site 3] | 10 | 6.91 | 6.56 | 12.26 | 21.71 | 6.91 | ... | 5.68 | 2.53 | 8.06 | 5.91 | 4.98 | 1.62 | Spread of 5.7 minutes between best and worst groups | Significant Disparity (Worst group travels 153% longer) | Highly Inequitable (Most deprived travel 62% longer) | LSOA Site 1 Site 4 Site 5 Site 6 \ 0 Brighton and Hove 027E 12.898833 8.197500 10.125667 9.248500 1 Brighton and Hove 027F 12.623167 9.351167 9.649500 8.972833 2 Brighton and Hove 027A 12.720667 6.840000 11.353833 9.289167 3 Brighton and Hove 029E 12.393667 6.328667 12.193000 9.293000 4 Brighton and Hove 029D 11.097500 5.216667 12.408333 9.508500 .. ... ... ... ... ... 160 Brighton and Hove 012A 7.442333 8.652667 10.433667 7.463000 161 Brighton and Hove 005C 7.830000 9.490000 8.769167 5.798500 162 Brighton and Hove 012B 7.742167 8.952500 10.841833 7.871000 163 Brighton and Hove 005A 9.458167 11.068500 10.397333 7.426667 164 Brighton and Hove 005B 8.258333 9.918333 9.197500 6.226833 min_cost selected_site within_threshold demand LSOA11NM \ 0 8.197500 Site 4 True 3627 Brighton and Hove 027E 1 8.972833 Site 6 True 2323 Brighton and Hove 027F 2 6.840000 Site 4 True 2596 Brighton and Hove 027A 3 6.328667 Site 4 True 3132 Brighton and Hove 029E 4 5.216667 Site 4 True 2883 Brighton and Hove 029D .. ... ... ... ... ... 160 7.442333 Site 1 True 2497 Brighton and Hove 012A 161 5.798500 Site 6 True 2570 Brighton and Hove 005C 162 7.742167 Site 1 True 2051 Brighton and Hove 012B 163 7.426667 Site 6 True 1164 Brighton and Hove 005A 164 6.226833 Site 6 True 1097 Brighton and Hove 005B IMD15 IMD15_raw 0 2 5040 1 3 9104 2 3 7483 3 2 6218 4 3 7018 .. ... ... 160 3 8891 161 2 5951 162 3 8814 163 7 21094 164 7 20761 [165 rows x 12 columns] |
| 14 | 15 | [Site 1, Site 2, Site 5, Site 6] | [0, 1, 4, 5] | [Site 3, Site 4] | 10 | 7.67 | 7.27 | 11.67 | 21.71 | 7.67 | ... | 5.34 | 2.55 | 8.43 | 7.10 | 4.82 | 1.75 | Spread of 5.3 minutes between best and worst groups | Significant Disparity (Worst group travels 155% longer) | Highly Inequitable (Most deprived travel 75% longer) | LSOA Site 1 Site 2 Site 5 Site 6 \ 0 Brighton and Hove 027E 12.898833 8.794833 10.125667 9.248500 1 Brighton and Hove 027F 12.623167 8.318500 9.649500 8.972833 2 Brighton and Hove 027A 12.720667 10.023000 11.353833 9.289167 3 Brighton and Hove 029E 12.393667 10.862000 12.193000 9.293000 4 Brighton and Hove 029D 11.097500 11.077500 12.408333 9.508500 .. ... ... ... ... ... 160 Brighton and Hove 012A 7.442333 14.745000 10.433667 7.463000 161 Brighton and Hove 005C 7.830000 13.080500 8.769167 5.798500 162 Brighton and Hove 012B 7.742167 15.153000 10.841833 7.871000 163 Brighton and Hove 005A 9.458167 14.708667 10.397333 7.426667 164 Brighton and Hove 005B 8.258333 13.508833 9.197500 6.226833 min_cost selected_site within_threshold demand LSOA11NM \ 0 8.794833 Site 2 True 3627 Brighton and Hove 027E 1 8.318500 Site 2 True 2323 Brighton and Hove 027F 2 9.289167 Site 6 True 2596 Brighton and Hove 027A 3 9.293000 Site 6 True 3132 Brighton and Hove 029E 4 9.508500 Site 6 True 2883 Brighton and Hove 029D .. ... ... ... ... ... 160 7.442333 Site 1 True 2497 Brighton and Hove 012A 161 5.798500 Site 6 True 2570 Brighton and Hove 005C 162 7.742167 Site 1 True 2051 Brighton and Hove 012B 163 7.426667 Site 6 True 1164 Brighton and Hove 005A 164 6.226833 Site 6 True 1097 Brighton and Hove 005B IMD15 IMD15_raw 0 2 5040 1 3 9104 2 3 7483 3 2 6218 4 3 7018 .. ... ... 160 3 8891 161 2 5951 162 3 8814 163 7 21094 164 7 20761 [165 rows x 12 columns] |
15 rows × 100 columns
By default this only affects the DataFrame that is returned – the underlying solution_df is untouched, so you can call show_solutions() again without the flag and get the compact version back.
If you would like the expansion to stick – e.g. because you are about to export solution_df to CSV, or want to sort_by a specific equity group’s column – pass inplace=True as well, and it is written back onto solution_df permanently.
solutions.show_solutions(expand_dict_columns=True, inplace=True)
[c for c in solutions.solution_df.columns if "equity_group" in c]
['weighted_by_equity_group__1',
'weighted_by_equity_group__2',
'weighted_by_equity_group__3',
'weighted_by_equity_group__4',
'weighted_by_equity_group__5',
'weighted_by_equity_group__6',
'weighted_by_equity_group__7',
'weighted_by_equity_group__8',
'weighted_by_equity_group__9',
'weighted_by_equity_group__10',
'unweighted_by_equity_group__1',
'unweighted_by_equity_group__2',
'unweighted_by_equity_group__3',
'unweighted_by_equity_group__4',
'unweighted_by_equity_group__5',
'unweighted_by_equity_group__6',
'unweighted_by_equity_group__7',
'unweighted_by_equity_group__8',
'unweighted_by_equity_group__9',
'unweighted_by_equity_group__10',
'coverage_by_equity_group__1',
'coverage_by_equity_group__2',
'coverage_by_equity_group__3',
'coverage_by_equity_group__4',
'coverage_by_equity_group__5',
'coverage_by_equity_group__6',
'coverage_by_equity_group__7',
'coverage_by_equity_group__8',
'coverage_by_equity_group__9',
'coverage_by_equity_group__10',
'coverage_regions_by_equity_group__1',
'coverage_regions_by_equity_group__2',
'coverage_regions_by_equity_group__3',
'coverage_regions_by_equity_group__4',
'coverage_regions_by_equity_group__5',
'coverage_regions_by_equity_group__6',
'coverage_regions_by_equity_group__7',
'coverage_regions_by_equity_group__8',
'coverage_regions_by_equity_group__9',
'coverage_regions_by_equity_group__10',
'max_cost_by_equity_group__1',
'max_cost_by_equity_group__2',
'max_cost_by_equity_group__3',
'max_cost_by_equity_group__4',
'max_cost_by_equity_group__5',
'max_cost_by_equity_group__6',
'max_cost_by_equity_group__7',
'max_cost_by_equity_group__8',
'max_cost_by_equity_group__9',
'max_cost_by_equity_group__10',
'regions_unreachable_by_equity_group__1',
'regions_unreachable_by_equity_group__2',
'regions_unreachable_by_equity_group__3',
'regions_unreachable_by_equity_group__4',
'regions_unreachable_by_equity_group__5',
'regions_unreachable_by_equity_group__6',
'regions_unreachable_by_equity_group__7',
'regions_unreachable_by_equity_group__8',
'regions_unreachable_by_equity_group__9',
'regions_unreachable_by_equity_group__10',
'demand_unreachable_by_equity_group__1',
'demand_unreachable_by_equity_group__2',
'demand_unreachable_by_equity_group__3',
'demand_unreachable_by_equity_group__4',
'demand_unreachable_by_equity_group__5',
'demand_unreachable_by_equity_group__6',
'demand_unreachable_by_equity_group__7',
'demand_unreachable_by_equity_group__8',
'demand_unreachable_by_equity_group__9',
'demand_unreachable_by_equity_group__10']You can also look at the problem dataframe for each individual solution. Doing this, we can see that we have retained the IMD15 decile and raw ranking for each LSOA, which can support custom plots.
example_problem_df = solutions.show_solutions()["problem_df"].iloc[0]example_problem_df| LSOA | Site 1 | Site 3 | Site 4 | Site 5 | min_cost | selected_site | within_threshold | demand | LSOA11NM | IMD15 | IMD15_raw | |
|---|---|---|---|---|---|---|---|---|---|---|---|---|
| 0 | Brighton and Hove 027E | 12.898833 | 7.404833 | 8.197500 | 10.125667 | 7.404833 | Site 3 | True | 3627 | Brighton and Hove 027E | 2 | 5040 |
| 1 | Brighton and Hove 027F | 12.623167 | 8.626167 | 9.351167 | 9.649500 | 8.626167 | Site 3 | True | 2323 | Brighton and Hove 027F | 3 | 9104 |
| 2 | Brighton and Hove 027A | 12.720667 | 8.633000 | 6.840000 | 11.353833 | 6.840000 | Site 4 | True | 2596 | Brighton and Hove 027A | 3 | 7483 |
| 3 | Brighton and Hove 029E | 12.393667 | 11.006000 | 6.328667 | 12.193000 | 6.328667 | Site 4 | True | 3132 | Brighton and Hove 029E | 2 | 6218 |
| 4 | Brighton and Hove 029D | 11.097500 | 10.970000 | 5.216667 | 12.408333 | 5.216667 | Site 4 | True | 2883 | Brighton and Hove 029D | 3 | 7018 |
| ... | ... | ... | ... | ... | ... | ... | ... | ... | ... | ... | ... | ... |
| 160 | Brighton and Hove 012A | 7.442333 | 18.468500 | 8.652667 | 10.433667 | 7.442333 | Site 1 | True | 2497 | Brighton and Hove 012A | 3 | 8891 |
| 161 | Brighton and Hove 005C | 7.830000 | 16.804000 | 9.490000 | 8.769167 | 7.830000 | Site 1 | True | 2570 | Brighton and Hove 005C | 2 | 5951 |
| 162 | Brighton and Hove 012B | 7.742167 | 18.876667 | 8.952500 | 10.841833 | 7.742167 | Site 1 | True | 2051 | Brighton and Hove 012B | 3 | 8814 |
| 163 | Brighton and Hove 005A | 9.458167 | 18.432167 | 11.068500 | 10.397333 | 9.458167 | Site 1 | True | 1164 | Brighton and Hove 005A | 7 | 21094 |
| 164 | Brighton and Hove 005B | 8.258333 | 17.232333 | 9.918333 | 9.197500 | 8.258333 | Site 1 | True | 1097 | Brighton and Hove 005B | 7 | 20761 |
165 rows × 12 columns
We can also then use this to conduct some additional groupings if they are not provided in the solution level dataframe, though this one is.
example_problem_df.groupby("IMD15")['min_cost'].agg("mean").round(2).reset_index()| IMD15 | min_cost | |
|---|---|---|
| 0 | 1 | 4.74 |
| 1 | 2 | 6.23 |
| 2 | 3 | 5.50 |
| 3 | 4 | 4.14 |
| 4 | 5 | 3.61 |
| 5 | 6 | 4.47 |
| 6 | 7 | 5.63 |
| 7 | 8 | 6.30 |
| 8 | 9 | 5.49 |
| 9 | 10 | 4.90 |
The check_solution_equity() method can do this automatically for the mean.
solutions.check_solution_equity()| IMD15 | min_cost | |
|---|---|---|
| 0 | 1 | 4.74 |
| 1 | 2 | 6.23 |
| 2 | 3 | 5.50 |
| 3 | 4 | 4.14 |
| 4 | 5 | 3.61 |
| 5 | 6 | 4.47 |
| 6 | 7 | 5.63 |
| 7 | 8 | 6.30 |
| 8 | 9 | 5.49 |
| 9 | 10 | 4.90 |
And we can also opt to explore this as a plot.
solutions.check_solution_equity(return_plot=True)solutions.check_solution_equity(return_plot=True, interactive=False);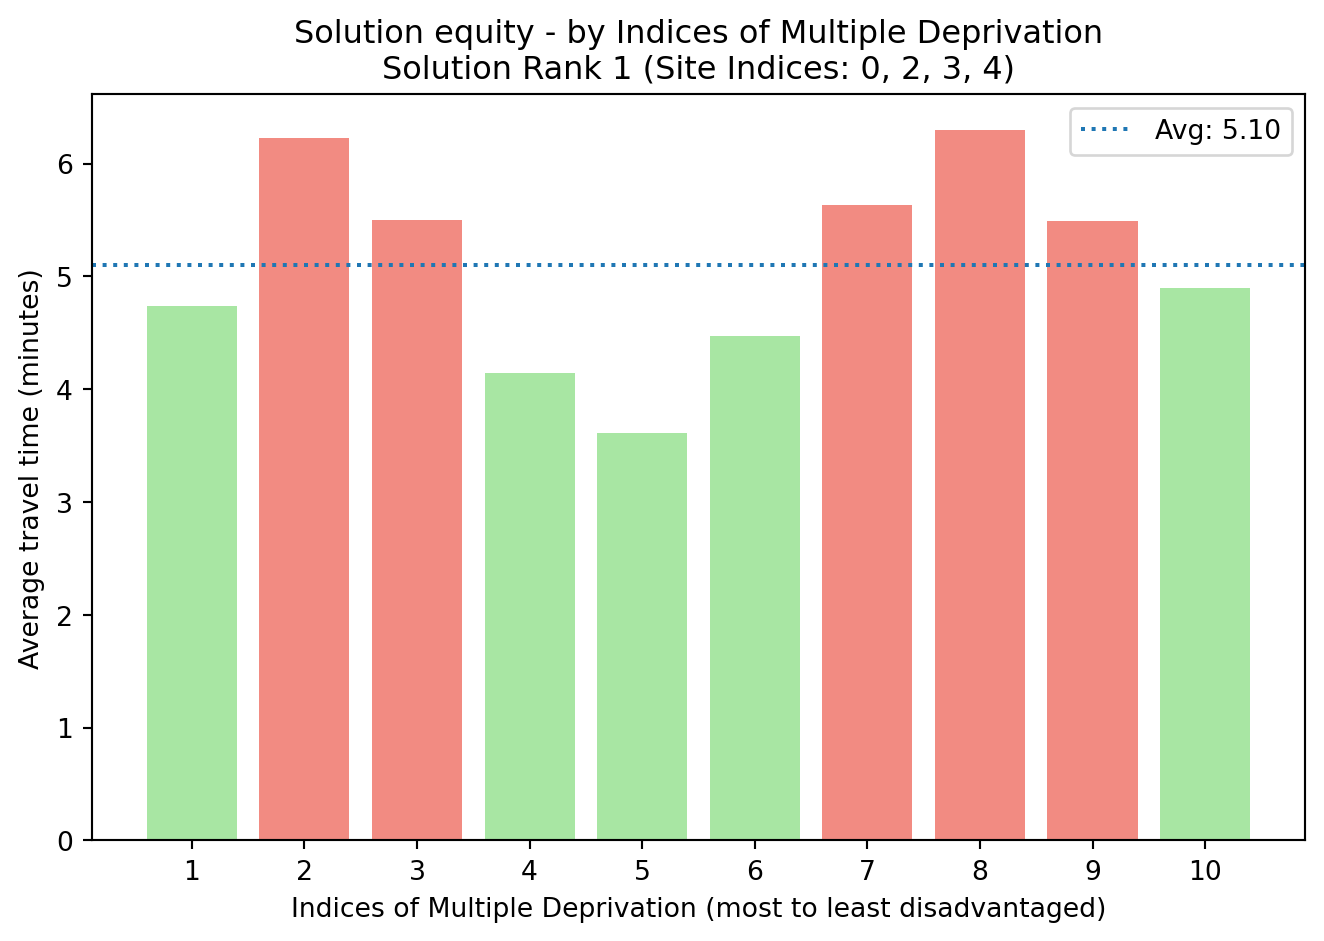
solutions.check_solution_equity(return_plot=True, interactive=False, colour_mode="gradient");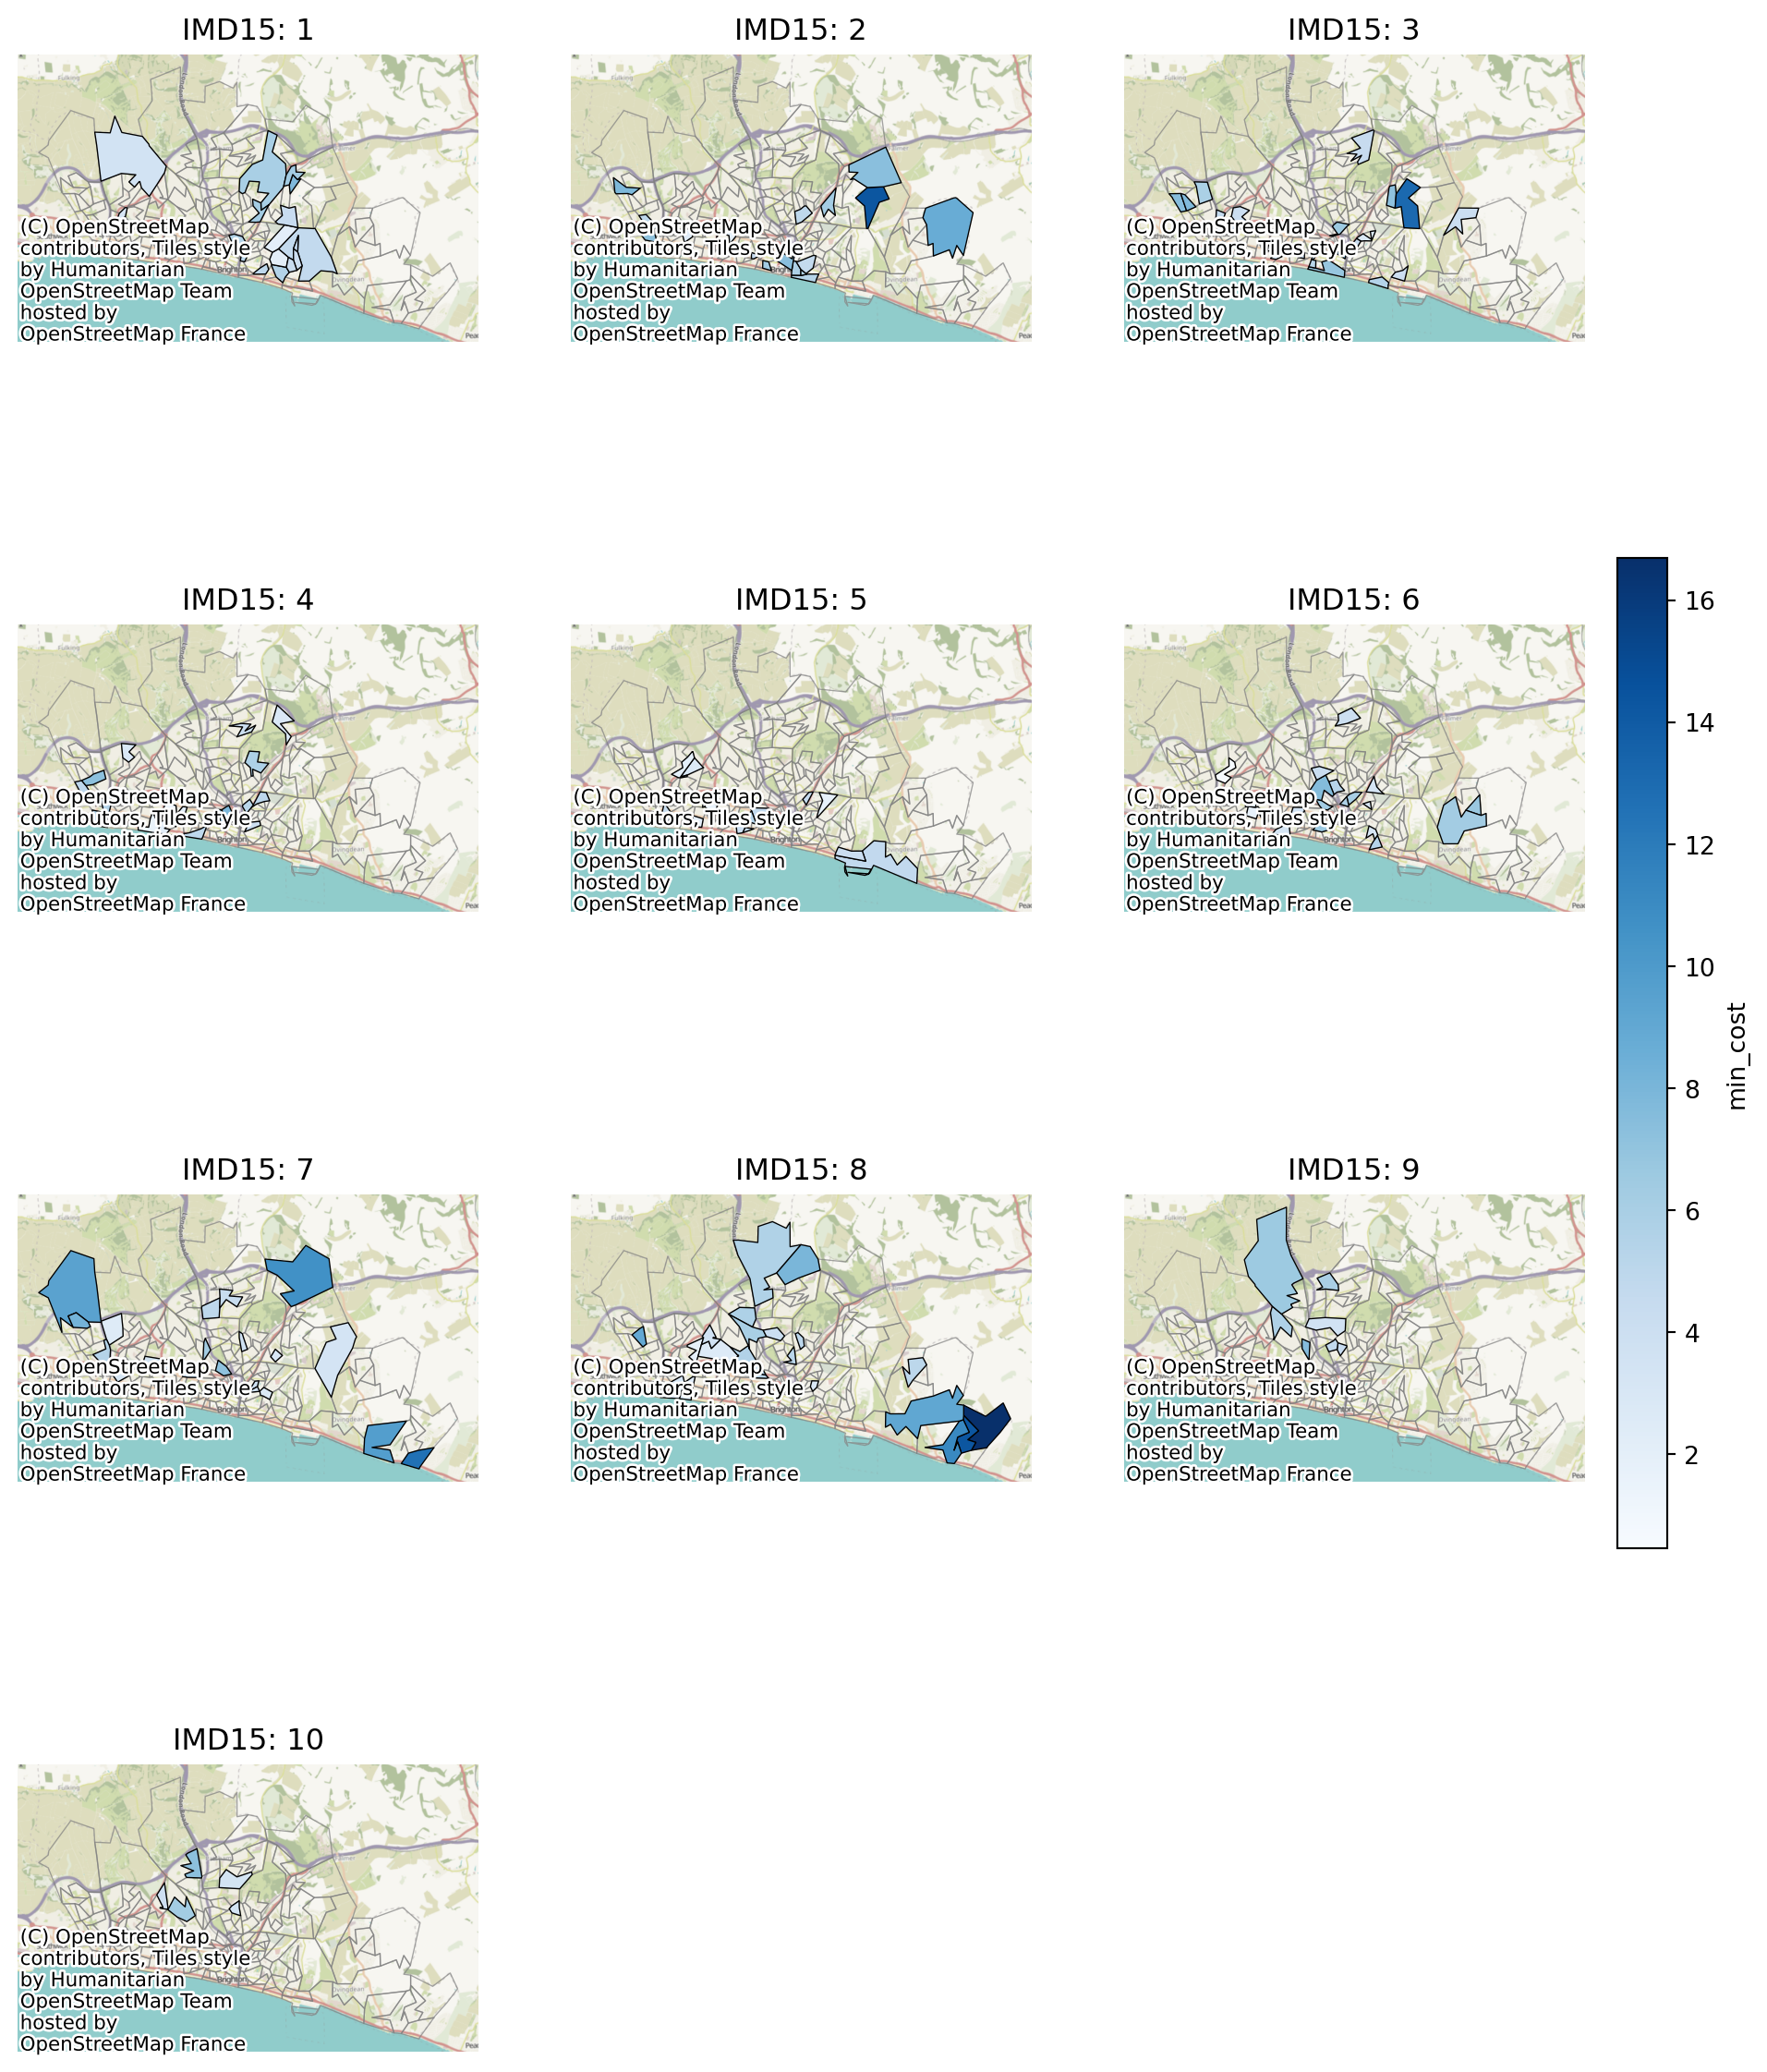
solutions.check_solution_equity(return_plot=True, interactive=False, colour_mode="above_below_avg");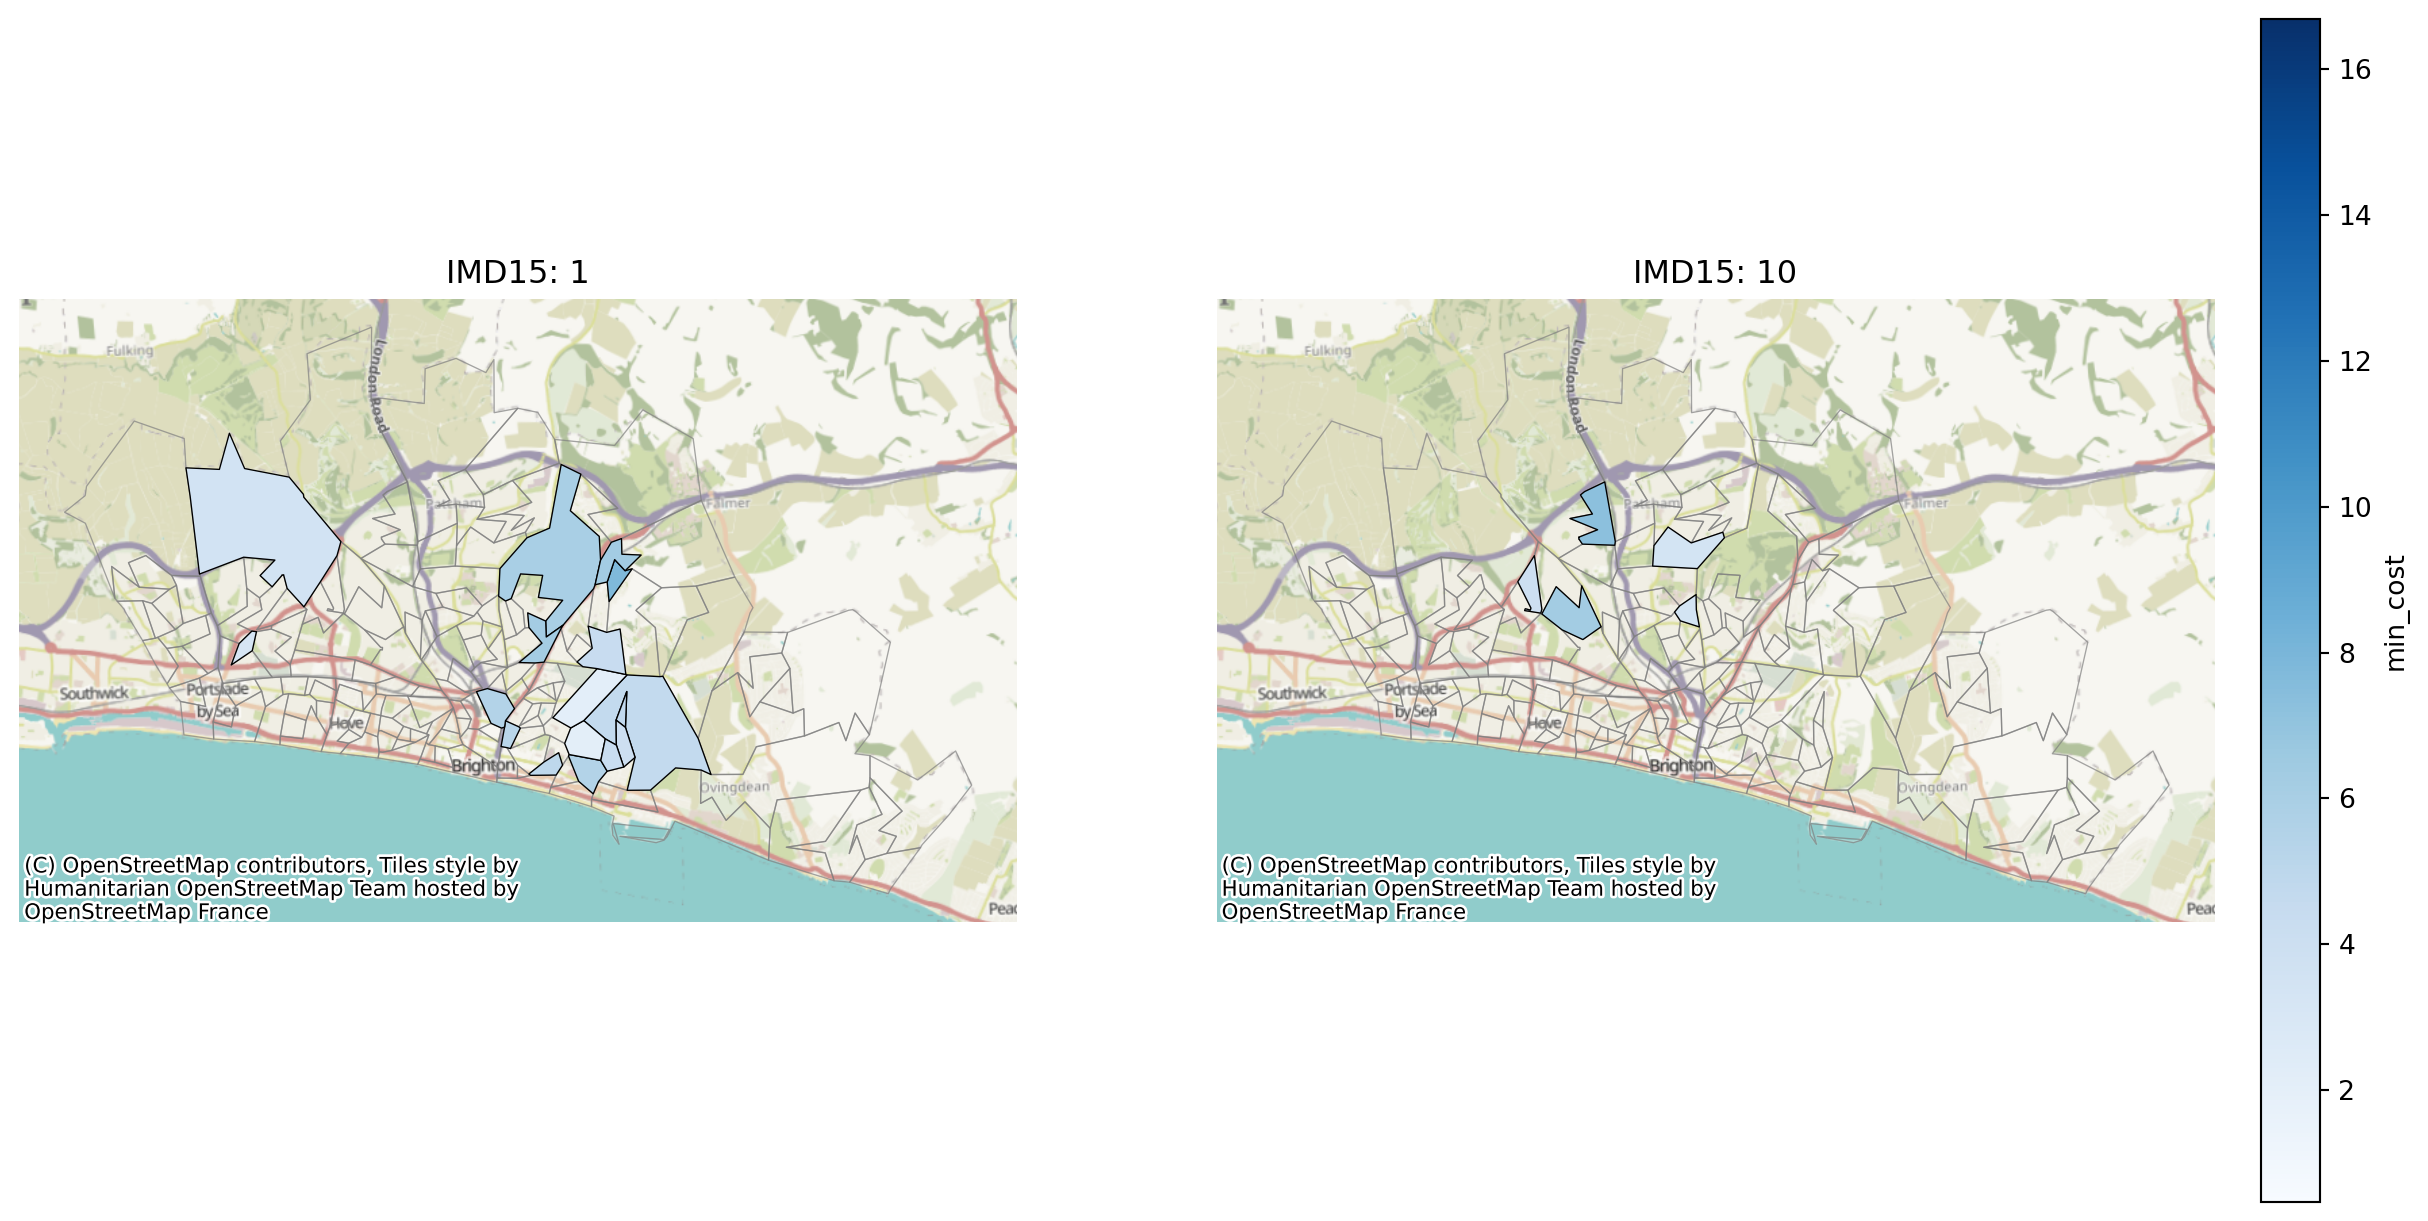
solutions.plot_top_n_solution_equity(cols=5, n=10);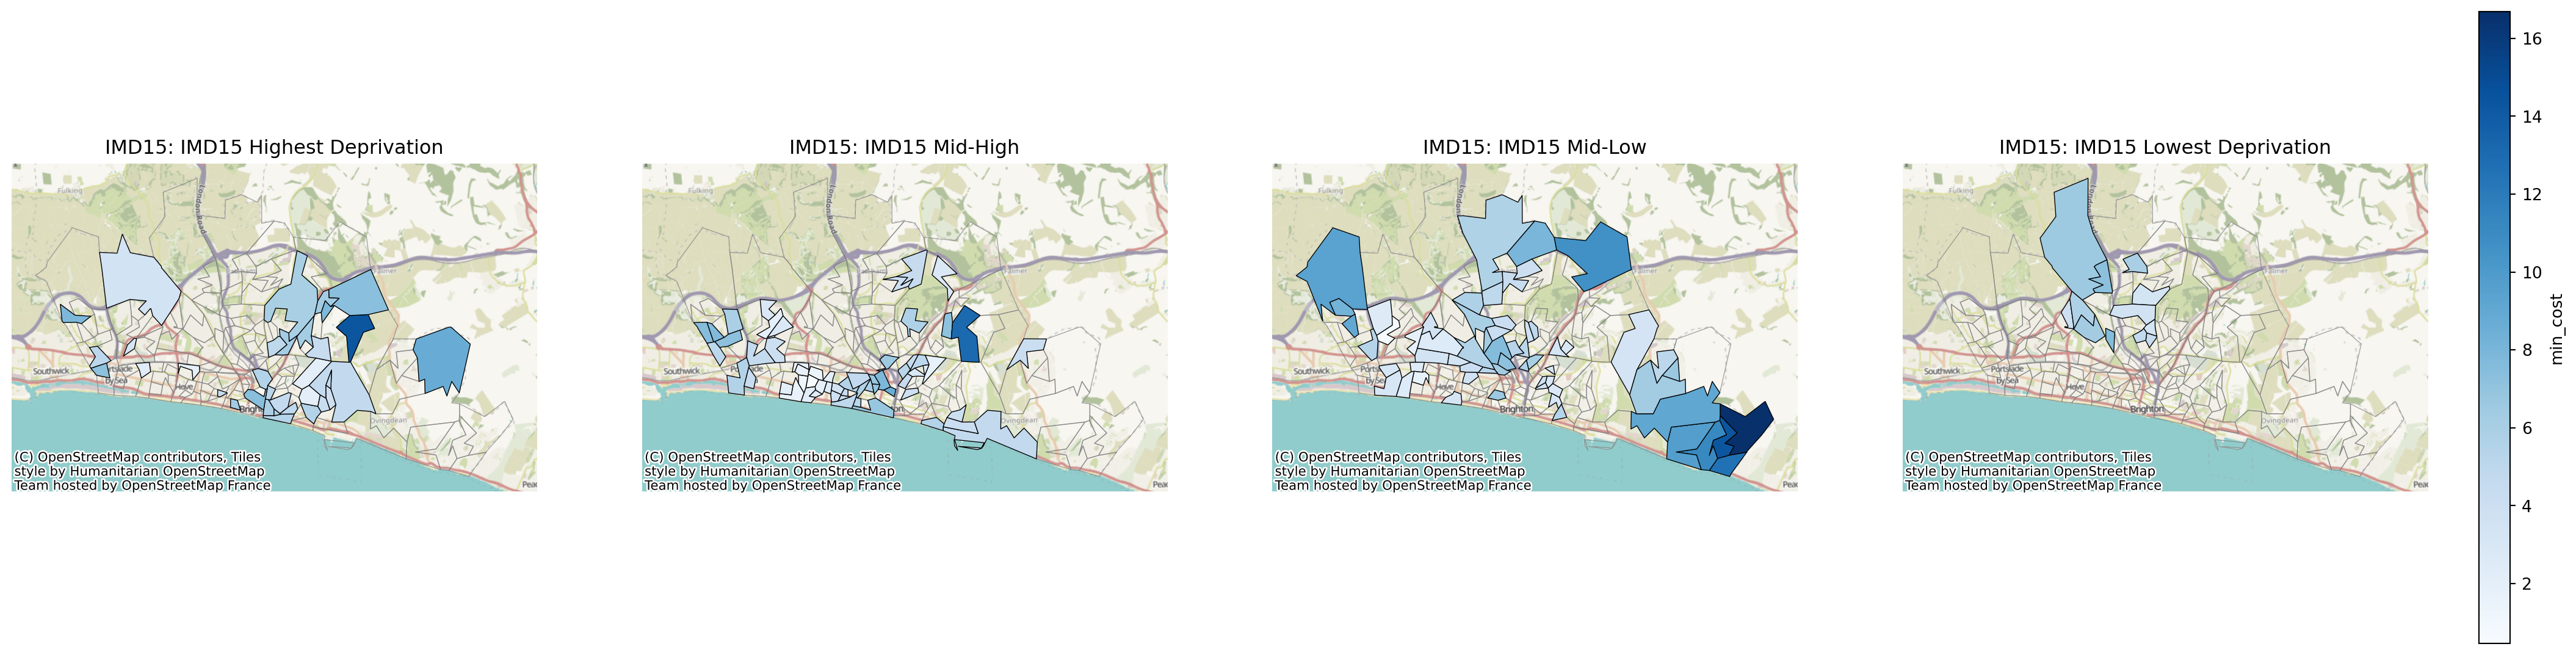
solutions.plot_top_n_solution_equity(cols=5, n=10, colour_mode="above_below_avg");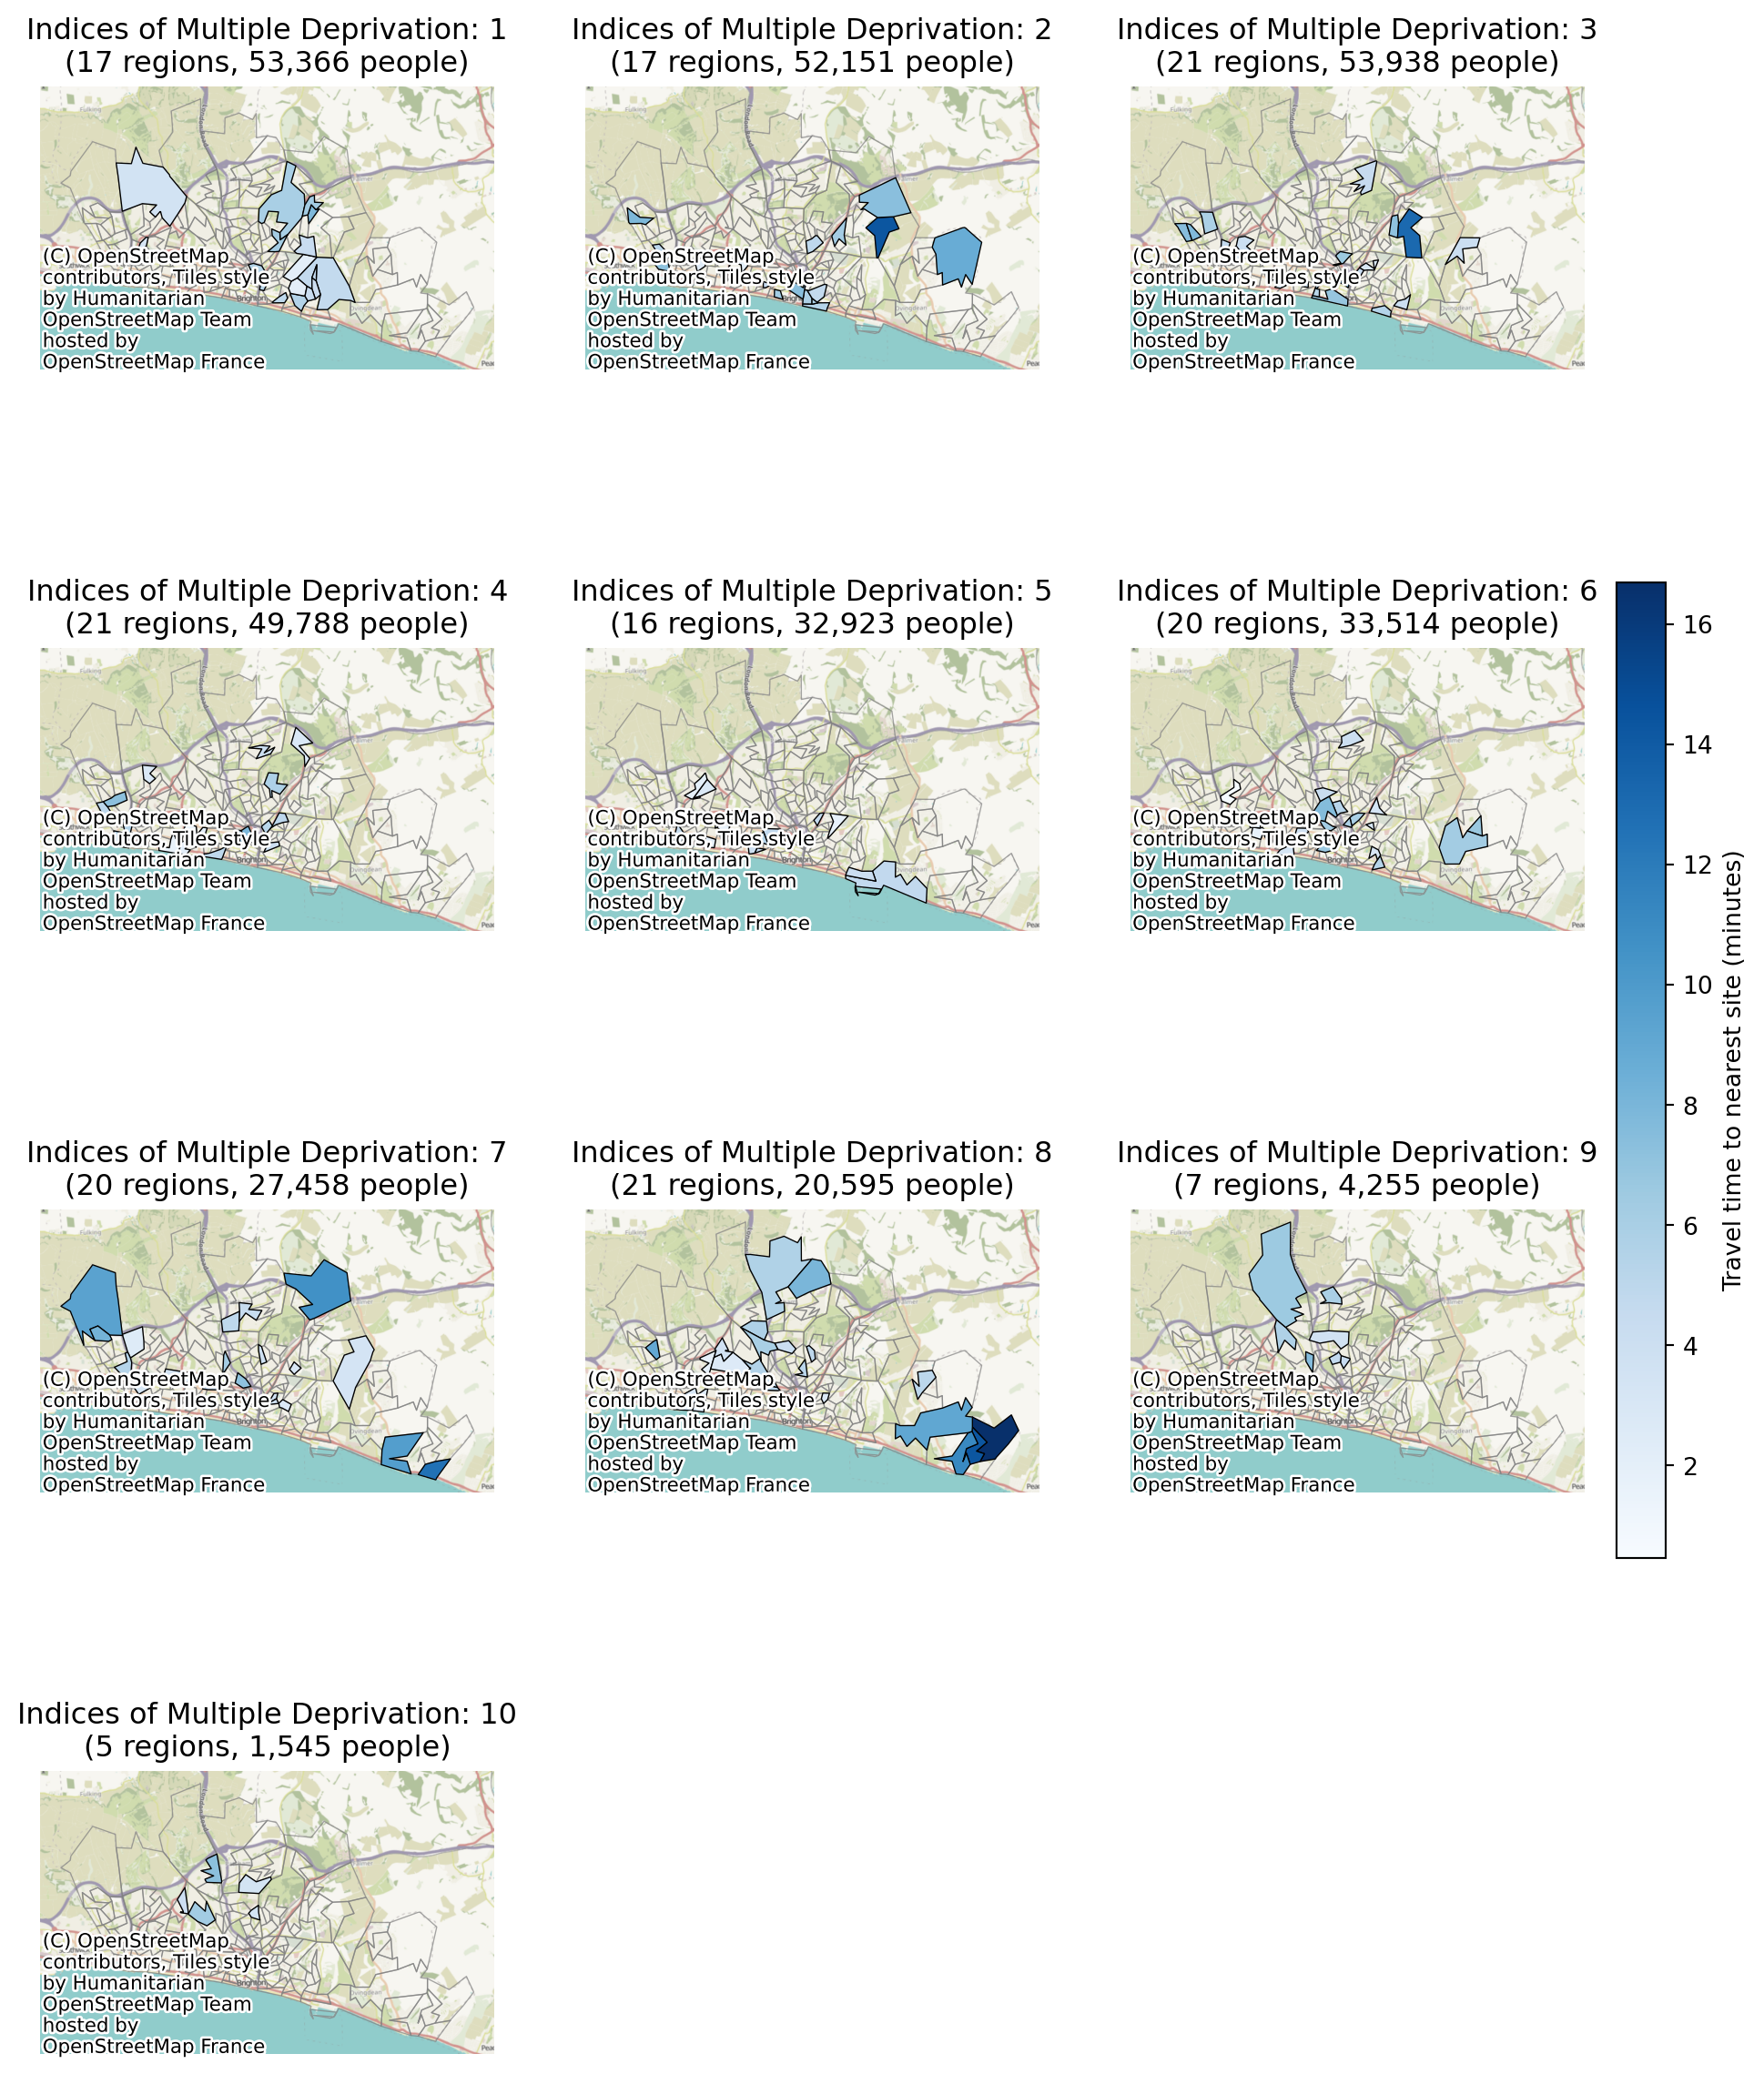
We can see for example that solution 2 is slightly worse for the most deprived group (IMD 1) than solution 1.
example_problem_df| LSOA | Site 1 | Site 3 | Site 4 | Site 5 | min_cost | selected_site | within_threshold | demand | LSOA11NM | IMD15 | IMD15_raw | |
|---|---|---|---|---|---|---|---|---|---|---|---|---|
| 0 | Brighton and Hove 027E | 12.898833 | 7.404833 | 8.197500 | 10.125667 | 7.404833 | Site 3 | True | 3627 | Brighton and Hove 027E | 2 | 5040 |
| 1 | Brighton and Hove 027F | 12.623167 | 8.626167 | 9.351167 | 9.649500 | 8.626167 | Site 3 | True | 2323 | Brighton and Hove 027F | 3 | 9104 |
| 2 | Brighton and Hove 027A | 12.720667 | 8.633000 | 6.840000 | 11.353833 | 6.840000 | Site 4 | True | 2596 | Brighton and Hove 027A | 3 | 7483 |
| 3 | Brighton and Hove 029E | 12.393667 | 11.006000 | 6.328667 | 12.193000 | 6.328667 | Site 4 | True | 3132 | Brighton and Hove 029E | 2 | 6218 |
| 4 | Brighton and Hove 029D | 11.097500 | 10.970000 | 5.216667 | 12.408333 | 5.216667 | Site 4 | True | 2883 | Brighton and Hove 029D | 3 | 7018 |
| ... | ... | ... | ... | ... | ... | ... | ... | ... | ... | ... | ... | ... |
| 160 | Brighton and Hove 012A | 7.442333 | 18.468500 | 8.652667 | 10.433667 | 7.442333 | Site 1 | True | 2497 | Brighton and Hove 012A | 3 | 8891 |
| 161 | Brighton and Hove 005C | 7.830000 | 16.804000 | 9.490000 | 8.769167 | 7.830000 | Site 1 | True | 2570 | Brighton and Hove 005C | 2 | 5951 |
| 162 | Brighton and Hove 012B | 7.742167 | 18.876667 | 8.952500 | 10.841833 | 7.742167 | Site 1 | True | 2051 | Brighton and Hove 012B | 3 | 8814 |
| 163 | Brighton and Hove 005A | 9.458167 | 18.432167 | 11.068500 | 10.397333 | 9.458167 | Site 1 | True | 1164 | Brighton and Hove 005A | 7 | 21094 |
| 164 | Brighton and Hove 005B | 8.258333 | 17.232333 | 9.918333 | 9.197500 | 8.258333 | Site 1 | True | 1097 | Brighton and Hove 005B | 7 | 20761 |
165 rows × 12 columns
solutions.plot_combination_by_equity();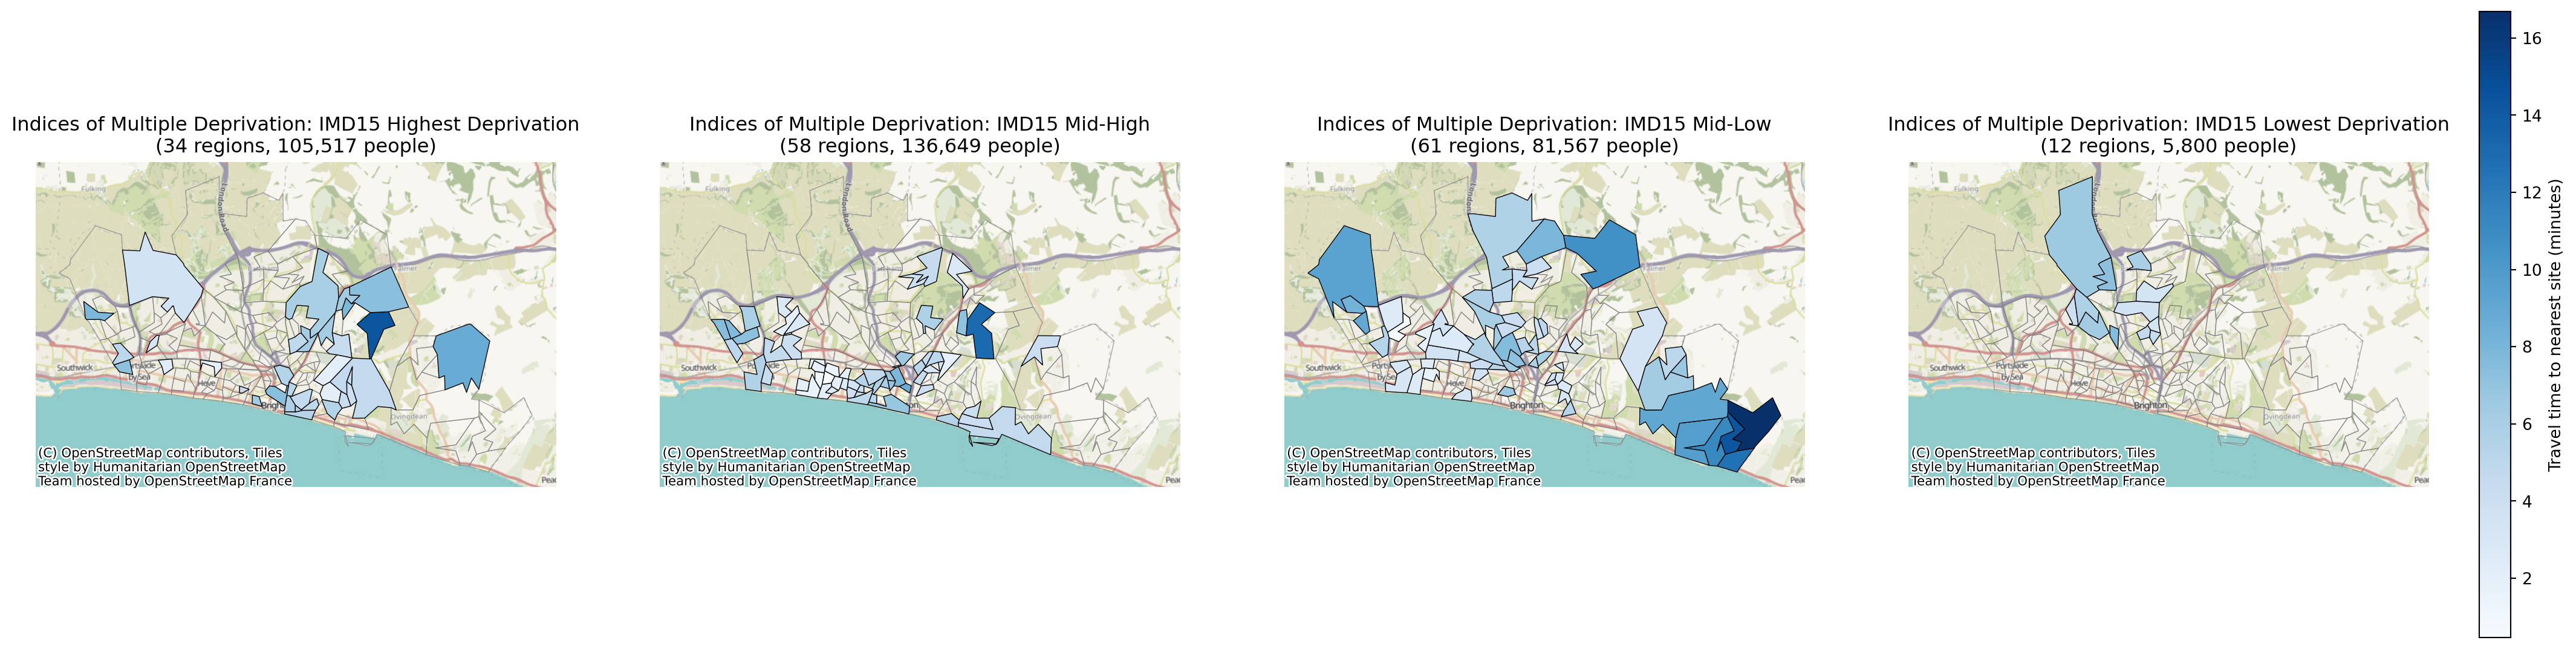
We can also choose to limit this to just certain groups.
solutions.plot_combination_by_equity(groups_to_include=[1,10], figsize_multiplier=8);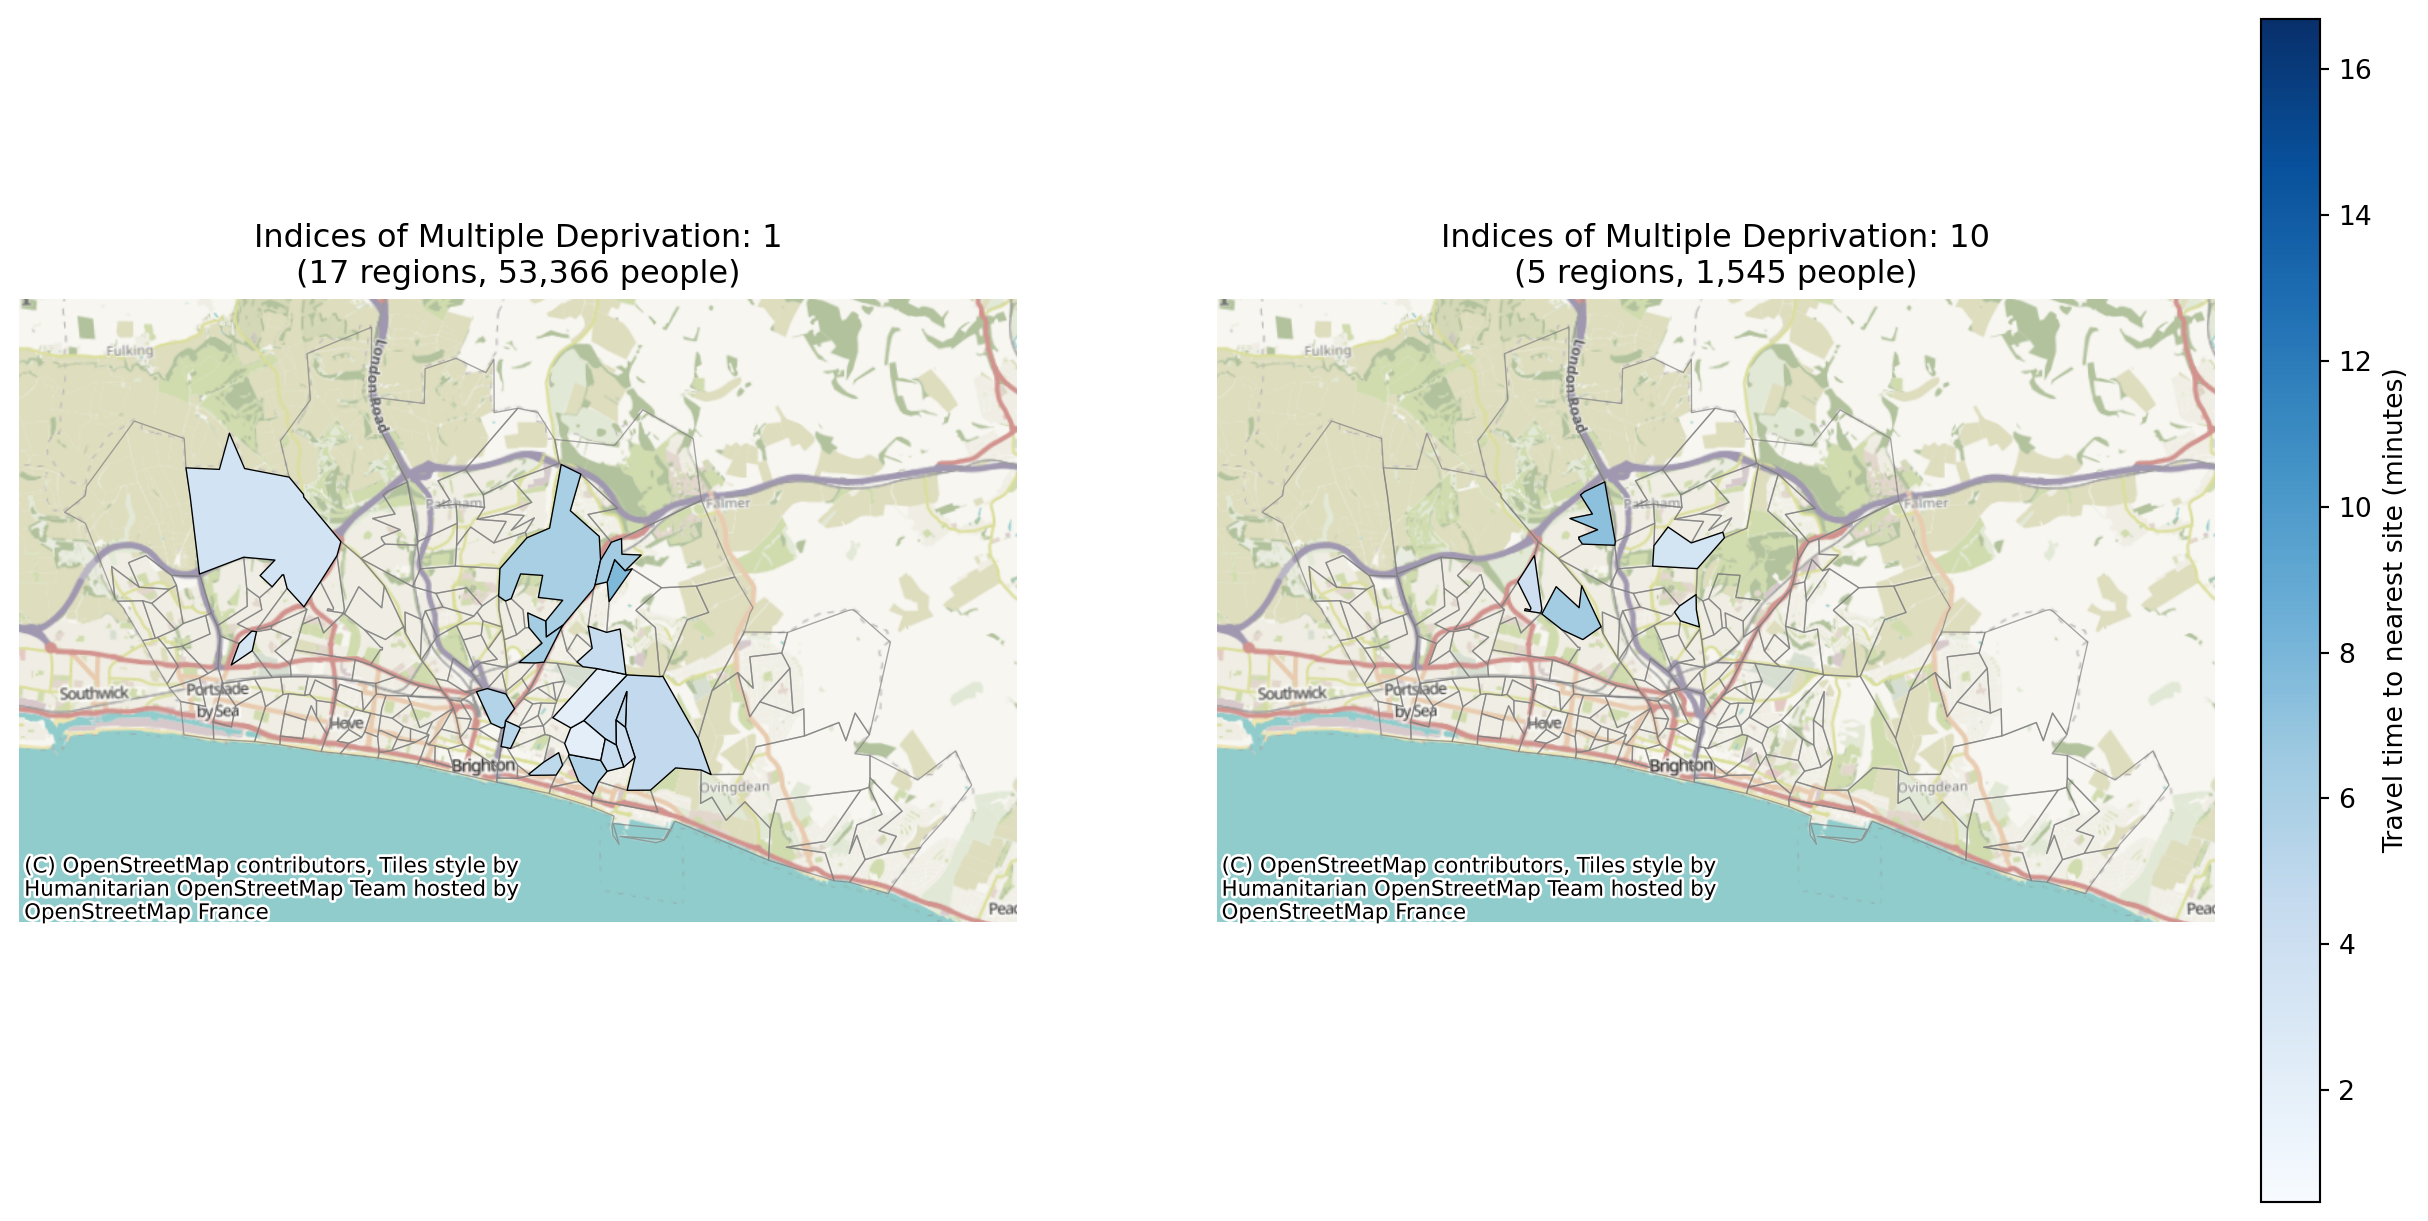
We can also combine multiple groups to display in a single plot.
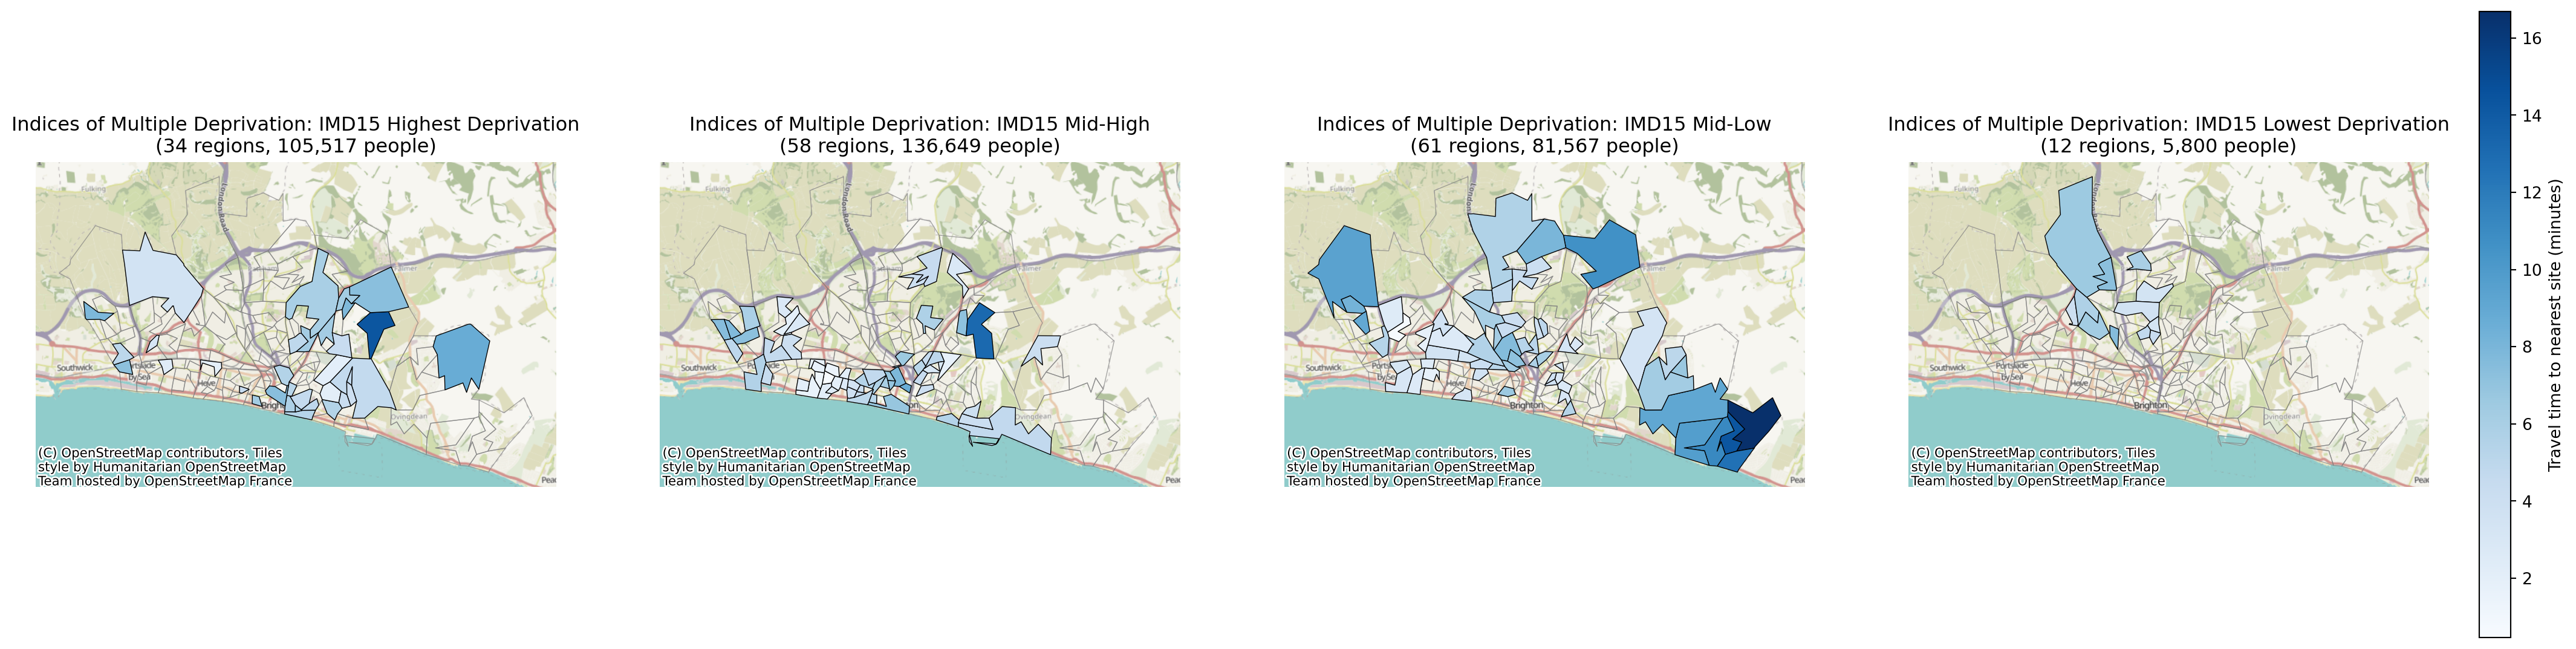
groupings = {
    "IMD15 Highest Deprivation": [1, 2],
    "IMD15 Mid-High": [3, 4, 5],
    "IMD15 Mid-Low": [6, 7, 8],
    "IMD15 Lowest Deprivation": [9, 10],
}

solutions.plot_combination_by_equity(groupings=groupings, figsize_multiplier=7, ncols=4);