import pandas as pd
import numpy as np
import re
from vidigi.prep import reshape_for_animations, generate_animation_df
from vidigi.animation import generate_animation
import plotly.io as pio
pio.renderers.default = "notebook"
WARM_UP = 60 * 1
RESULTS_COLLECTION = 90 * 1Deep Dive: Ways of visualising larger queues
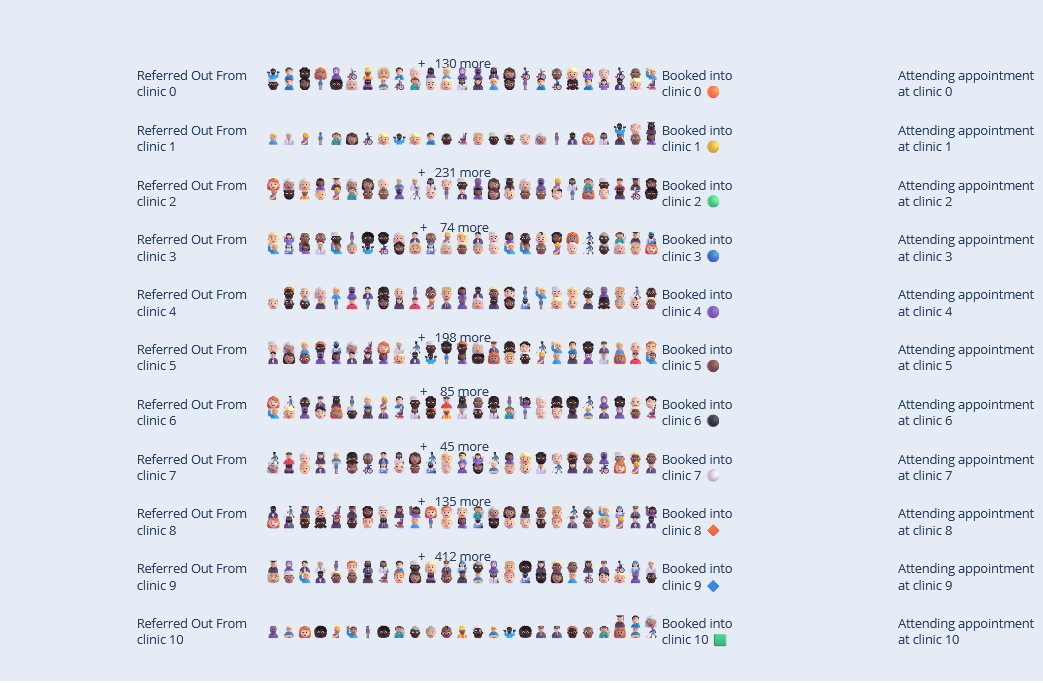
While vidigi originally provided only a simple way to see the size of larger queues (via the ‘+ x more’ text that appears when the snapshot max is exceeded), this is not particularly visually intuitive for understanding the magnitude of the different queues that are building up.
We could use the synchronised subplot approach from the Additional Synchronised Traces - Orthopaedic Ward - Hospital Efficiency Project example or the gas station example, but when we have multiple steps it could still be challenging to quickly get a sense of where the queues are as your users will have to look across at different parts of the page, and it can be quite a cumbersome thing to add in.
Instead, it would be better to be able to quickly get a sense of queue size directly next to the relevant step. This poses some challenges in vidigi and there are some limitations - but it is possible!
Some of what is shown in this example has now been incorporated into vidigi as an official alternative to the ‘+ x more’ snapshot as part of release 1.1.0, and the ‘+ x more’ text can be swapped out for gauges simply by setting step_snapshot_limit_gauges=True in either generate_animation_df() or animate_activity_log(). There is also a helper function - prep.ascii_queue_icon() - that could be used to add gauges in manually between the generate_animation_df() and generate_animation() steps.
However, seeing under the hood will hopefully help you adapt this approach for your own more complex animations.
We’ll be working with some of the outputs from the first ‘resourceless’ animation example - the mental health appointment booking model.
By the end of that model, we have some queues with as few as 28 people waiting, and some with as high as 462! But because of the way it’s displayed, it’s not easy to get a sense of that.
Let’s kick off with our imports. We’ll be using the separate functions so we can make some changes to the dataframes that get produced along the way.
We’ve saved the event log produced by the mental health model, so let’s import it here.
event_log_df = pd.read_csv("as-is.csv")We kick off with a pretty normal call of reshape_for_animations, other than setting the step_snapshot_max to be far higher than what is usually seen, and ensuring it’s so high that the model queue will never reach this level (ensuring we get every entity at every stage).
full_patient_df = reshape_for_animations(
event_log_df,
entity_col_name="patient",
limit_duration=WARM_UP+RESULTS_COLLECTION,
every_x_time_units=1,
step_snapshot_max=9999999,
)
# Remove the warm-up period from the event log
full_patient_df = full_patient_df[full_patient_df["snapshot_time"] >= WARM_UP]Now, for only the stage we want to display as bars instead of individual entities, we will count the total number of patients queueuing at that stage.
We also need to give each event within this new dataframe a consistent entity ID across all snapshot_times so it will animate correctly.
reshaped_df = full_patient_df.groupby(['snapshot_time', 'event', 'event_type'])['patient'].count().reset_index()
reshaped_df = reshaped_df[(reshaped_df["event"].str.contains("appointment_booked_waiting")) | reshaped_df["event"].str.contains("referred_out")]
event_id_map = {event: idx for idx, event in enumerate(reshaped_df['event'].unique())}
reshaped_df['entity_id'] = reshaped_df['event'].map(event_id_map)
reshaped_df['entity_id'] = reshaped_df['entity_id'].apply(lambda x: f"BAR{x}")
reshaped_df['time'] = reshaped_df['snapshot_time']
reshaped_df = reshaped_df.rename(columns={'patient': 'patient_count'})
reshaped_df.head(40)| snapshot_time | event | event_type | patient_count | entity_id | time | |
|---|---|---|---|---|---|---|
| 0 | 60 | appointment_booked_waiting_0 | queue | 61 | BAR0 | 60 |
| 1 | 60 | appointment_booked_waiting_1 | queue | 9 | BAR1 | 60 |
| 2 | 60 | appointment_booked_waiting_10 | queue | 7 | BAR2 | 60 |
| 3 | 60 | appointment_booked_waiting_2 | queue | 139 | BAR3 | 60 |
| 4 | 60 | appointment_booked_waiting_3 | queue | 52 | BAR4 | 60 |
| 5 | 60 | appointment_booked_waiting_4 | queue | 23 | BAR5 | 60 |
| 6 | 60 | appointment_booked_waiting_5 | queue | 114 | BAR6 | 60 |
| 7 | 60 | appointment_booked_waiting_6 | queue | 61 | BAR7 | 60 |
| 8 | 60 | appointment_booked_waiting_7 | queue | 34 | BAR8 | 60 |
| 9 | 60 | appointment_booked_waiting_8 | queue | 78 | BAR9 | 60 |
| 10 | 60 | appointment_booked_waiting_9 | queue | 212 | BAR10 | 60 |
| 23 | 60 | referred_out_0 | queue | 6 | BAR11 | 60 |
| 24 | 60 | referred_out_2 | queue | 3 | BAR12 | 60 |
| 25 | 60 | referred_out_3 | queue | 1 | BAR13 | 60 |
| 26 | 60 | referred_out_4 | queue | 1 | BAR14 | 60 |
| 27 | 60 | referred_out_6 | queue | 1 | BAR15 | 60 |
| 28 | 60 | referred_out_7 | queue | 1 | BAR16 | 60 |
| 29 | 60 | referred_out_8 | queue | 4 | BAR17 | 60 |
| 30 | 60 | referred_out_9 | queue | 7 | BAR18 | 60 |
| 31 | 61 | appointment_booked_waiting_0 | queue | 69 | BAR0 | 61 |
| 32 | 61 | appointment_booked_waiting_1 | queue | 9 | BAR1 | 61 |
| 33 | 61 | appointment_booked_waiting_10 | queue | 8 | BAR2 | 61 |
| 34 | 61 | appointment_booked_waiting_2 | queue | 148 | BAR3 | 61 |
| 35 | 61 | appointment_booked_waiting_3 | queue | 56 | BAR4 | 61 |
| 36 | 61 | appointment_booked_waiting_4 | queue | 23 | BAR5 | 61 |
| 37 | 61 | appointment_booked_waiting_5 | queue | 117 | BAR6 | 61 |
| 38 | 61 | appointment_booked_waiting_6 | queue | 66 | BAR7 | 61 |
| 39 | 61 | appointment_booked_waiting_7 | queue | 36 | BAR8 | 61 |
| 40 | 61 | appointment_booked_waiting_8 | queue | 81 | BAR9 | 61 |
| 41 | 61 | appointment_booked_waiting_9 | queue | 219 | BAR10 | 61 |
| 44 | 61 | referred_out_0 | queue | 3 | BAR11 | 61 |
| 45 | 61 | referred_out_2 | queue | 3 | BAR12 | 61 |
| 46 | 61 | referred_out_7 | queue | 1 | BAR16 | 61 |
| 47 | 61 | referred_out_8 | queue | 1 | BAR17 | 61 |
| 48 | 61 | referred_out_9 | queue | 5 | BAR18 | 61 |
| 49 | 62 | appointment_booked_waiting_0 | queue | 74 | BAR0 | 62 |
| 50 | 62 | appointment_booked_waiting_1 | queue | 10 | BAR1 | 62 |
| 51 | 62 | appointment_booked_waiting_10 | queue | 8 | BAR2 | 62 |
| 52 | 62 | appointment_booked_waiting_2 | queue | 153 | BAR3 | 62 |
| 53 | 62 | appointment_booked_waiting_3 | queue | 58 | BAR4 | 62 |
OPTIONAL - but recommend.
Let’s ensure that there’s a count of patients referred out at every point in time. This will ensure we don’t end up with the counts appearing and disappearing across the course of the animation.
# 1a. Extract unique snapshot_times
snapshot_times = reshaped_df['snapshot_time'].unique()
# 1b. Extract unique 'referred_out' event values only
referred_out_events = reshaped_df.loc[reshaped_df['event'].str.startswith('referred_out'), 'event'].unique()
# 2. Create a MultiIndex of all combinations of snapshot_time and referred_out_events
full_index = pd.MultiIndex.from_product(
[snapshot_times, referred_out_events],
names=['snapshot_time', 'event']
)
# 3. Set index of the df to ['snapshot_time', 'event'] to facilitate reindexing
df_referred = reshaped_df.set_index(['snapshot_time', 'event'])
# 4. Reindex to full index, filling missing rows with patient_count = 0
df_referred = df_referred.reindex(full_index).reset_index()
# 5. For the new rows where patient_count was filled, fill missing columns like event_type, entity_id, time
df_referred['patient_count'] = df_referred['patient_count'].fillna(0)
df_referred['event_type'] ='queue'
df_referred['time'] = df_referred['snapshot_time']
# Build a dictionary mapping each referred_out event to its corresponding entity_id
event_to_entity = reshaped_df.loc[
reshaped_df['event'].str.startswith('referred_out'),
['event', 'entity_id']
].drop_duplicates().set_index('event')['entity_id'].to_dict()
# Assign using map
df_referred['entity_id'] = df_referred['event'].map(event_to_entity)
# 6. Join this back into our dataframe
final_count_df = pd.concat([
reshaped_df[reshaped_df['event'].str.contains("appointment_booked_waiting")],
df_referred
])We then join this back to the original dataframe, ensuring we first get rid of the entity-level rows for the stage we’ve just done the counts for.
full_patient_df = pd.concat(
[full_patient_df[(~full_patient_df["event"].str.contains("appointment_booked_waiting")) &
(~full_patient_df["event"].str.contains("referred_out"))].rename(columns={"patient": "entity_id"}),
final_count_df],
ignore_index=True
)
# If we don't fill the NA values with a float number, we encounter issues later where certain actions can't be performed due to the data type of missing values.
full_patient_df["patient_count"] = full_patient_df["patient_count"].fillna(0.0)
full_patient_df = full_patient_df.sort_values(["snapshot_time", "time", "entity_id"])Now let’s read in our entity positioning dataframe and carry on with the animation steps.
event_position_df = pd.read_csv("as-is_event_position_df.csv")
# We just use this line to slightly modify the position of one set of our events
event_position_df['x'] = event_position_df.apply(
lambda row: row['x'] - 120
if "appointment_booked_waiting" in row['event']
else row['x'], # fallback to original value
axis=1
)
event_position_df| event | y | x | label | clinic | |
|---|---|---|---|---|---|
| 0 | appointment_booked_waiting_0 | 870.0 | 505 | Booked into<br>clinic 0 🟠 | 0.0 |
| 1 | appointment_booked_waiting_1 | 790.0 | 505 | Booked into<br>clinic 1 🟡 | 1.0 |
| 2 | appointment_booked_waiting_2 | 710.0 | 505 | Booked into<br>clinic 2 🟢 | 2.0 |
| 3 | appointment_booked_waiting_3 | 630.0 | 505 | Booked into<br>clinic 3 🔵 | 3.0 |
| 4 | appointment_booked_waiting_4 | 550.0 | 505 | Booked into<br>clinic 4 🟣 | 4.0 |
| 5 | appointment_booked_waiting_5 | 470.0 | 505 | Booked into<br>clinic 5 🟤 | 5.0 |
| 6 | appointment_booked_waiting_6 | 390.0 | 505 | Booked into<br>clinic 6 ⚫ | 6.0 |
| 7 | appointment_booked_waiting_7 | 310.0 | 505 | Booked into<br>clinic 7 ⚪ | 7.0 |
| 8 | appointment_booked_waiting_8 | 230.0 | 505 | Booked into<br>clinic 8 🔶 | 8.0 |
| 9 | appointment_booked_waiting_9 | 150.0 | 505 | Booked into<br>clinic 9 🔷 | 9.0 |
| 10 | appointment_booked_waiting_10 | 70.0 | 505 | Booked into<br>clinic 10 🟩 | 10.0 |
| 11 | have_appointment_0 | 870.0 | 850 | Attending appointment<br>at clinic 0 | NaN |
| 12 | have_appointment_1 | 790.0 | 850 | Attending appointment<br>at clinic 1 | NaN |
| 13 | have_appointment_2 | 710.0 | 850 | Attending appointment<br>at clinic 2 | NaN |
| 14 | have_appointment_3 | 630.0 | 850 | Attending appointment<br>at clinic 3 | NaN |
| 15 | have_appointment_4 | 550.0 | 850 | Attending appointment<br>at clinic 4 | NaN |
| 16 | have_appointment_5 | 470.0 | 850 | Attending appointment<br>at clinic 5 | NaN |
| 17 | have_appointment_6 | 390.0 | 850 | Attending appointment<br>at clinic 6 | NaN |
| 18 | have_appointment_7 | 310.0 | 850 | Attending appointment<br>at clinic 7 | NaN |
| 19 | have_appointment_8 | 230.0 | 850 | Attending appointment<br>at clinic 8 | NaN |
| 20 | have_appointment_9 | 150.0 | 850 | Attending appointment<br>at clinic 9 | NaN |
| 21 | have_appointment_10 | 70.0 | 850 | Attending appointment<br>at clinic 10 | NaN |
| 22 | referred_out_0 | 870.0 | 125 | Referred Out From <br>clinic 0 | NaN |
| 23 | referred_out_1 | 790.0 | 125 | Referred Out From <br>clinic 1 | NaN |
| 24 | referred_out_2 | 710.0 | 125 | Referred Out From <br>clinic 2 | NaN |
| 25 | referred_out_3 | 630.0 | 125 | Referred Out From <br>clinic 3 | NaN |
| 26 | referred_out_4 | 550.0 | 125 | Referred Out From <br>clinic 4 | NaN |
| 27 | referred_out_5 | 470.0 | 125 | Referred Out From <br>clinic 5 | NaN |
| 28 | referred_out_6 | 390.0 | 125 | Referred Out From <br>clinic 6 | NaN |
| 29 | referred_out_7 | 310.0 | 125 | Referred Out From <br>clinic 7 | NaN |
| 30 | referred_out_8 | 230.0 | 125 | Referred Out From <br>clinic 8 | NaN |
| 31 | referred_out_9 | 150.0 | 125 | Referred Out From <br>clinic 9 | NaN |
| 32 | referred_out_10 | 70.0 | 125 | Referred Out From <br>clinic 10 | NaN |
full_df_plus_pos = generate_animation_df(
full_entity_df=full_patient_df,
entity_col_name="entity_id",
event_position_df=event_position_df,
wrap_queues_at=25,
step_snapshot_max=9999999,
gap_between_entities=20,
gap_between_queue_rows=15,
debug_mode=True
)Placement dataframe started construction at 16:36:49
Placement dataframe finished construction at 16:36:49/tmp/ipykernel_960/2093940145.py:1: UserWarning: `step_snapshot_max` is not a multiple of `wrap_queues_at`.The animation will display better if this is resolved.
full_df_plus_pos = generate_animation_df(We’re now going to define a new function that helps us to swap out the counts for an interpretable bar.
def ascii_queue_icon(count, max_count, bar_length=10, filled_char="█", empty_char="░", count_only=False):
"""
Returns an ASCII progress bar string representing the queue length.
Args:
count (int): The current patient count.
max_count (int): The maximum patient count in the data.
bar_length (int): Total length of the bar in characters.
filled_char (str): Character to use for filled segments.
empty_char (str): Character to use for empty segments.
Returns:
str: ASCII progress bar string.
"""
if count_only:
if isinstance(count, str):
return count
else:
return f"{count:.0f}"
else:
if max_count == 0:
return empty_char * bar_length # avoid division by zero
if not np.isnan(count):
filled_len = int(round(bar_length * count / max_count))
bar = filled_char * filled_len + empty_char * (bar_length - filled_len)
return f"[{bar}] {count:.0f}"Let’s now add this into our dataframe.
full_df_plus_pos['patient_cumulative'] = full_df_plus_pos.sort_values('snapshot_time').groupby(['event'])['patient_count'].cumsum()
full_df_plus_pos['patient_cumulative_count_display'] = full_df_plus_pos.apply(
lambda row: f"{row['patient_cumulative']:.0f} (+{row['patient_count']:.0f})", # fallback to original value
axis=1
)# Calculate max patient count only from relevant events
max_count = full_df_plus_pos.loc[
full_df_plus_pos['event'].str.contains("appointment_booked_waiting"), 'patient_count'
].max()
# Update the icon column conditionally
full_df_plus_pos['icon'] = full_df_plus_pos.apply(
lambda row: ascii_queue_icon(row['patient_count'], max_count, 20)
if "appointment_booked_waiting" in row['event']
else row['icon'], # fallback to original value
axis=1
)
full_df_plus_pos['icon'] = full_df_plus_pos.apply(
lambda row: ascii_queue_icon(row['patient_cumulative_count_display'], max_count, count_only=True)
if "referred_out" in row['event']
else row['icon'], # fallback to original value
axis=1
)
# Also move the icons over a bit
full_df_plus_pos['x_final'] = full_df_plus_pos.apply(
lambda row: row['x_final'] - 100
if "appointment_booked_waiting" in row['event']
else row['x_final'], # fallback to original value
axis=1
)
full_df_plus_pos['x_final'] = full_df_plus_pos.apply(
lambda row: row['x_final'] - 50
if "referred" in row['event']
else row['x_final'], # fallback to original value
axis=1
)From the sample below, we can see some examples of what the icon will now look like.
full_df_plus_pos[full_df_plus_pos["event"].str.contains("appointment_booked_waiting")]| index | entity_id | pathway | event_type | event | home_clinic | time | booked_clinic | wait | event_original | ... | y_final | x | label | clinic | x_final | row | icon | opacity | patient_cumulative | patient_cumulative_count_display | |
|---|---|---|---|---|---|---|---|---|---|---|---|---|---|---|---|---|---|---|---|---|---|
| 0 | NaN | BAR0 | NaN | queue | appointment_booked_waiting_0 | NaN | 60 | NaN | NaN | NaN | ... | 870.0 | 505.0 | Booked into<br>clinic 0 🟠 | 0.0 | 405.0 | 0.0 | [███░░░░░░░░░░░░░░░░░] 61 | 1.0 | 61.0 | 61 (+61) |
| 1 | NaN | BAR0 | NaN | queue | appointment_booked_waiting_0 | NaN | 61 | NaN | NaN | NaN | ... | 870.0 | 505.0 | Booked into<br>clinic 0 🟠 | 0.0 | 405.0 | 0.0 | [███░░░░░░░░░░░░░░░░░] 69 | 1.0 | 130.0 | 130 (+69) |
| 2 | NaN | BAR0 | NaN | queue | appointment_booked_waiting_0 | NaN | 62 | NaN | NaN | NaN | ... | 870.0 | 505.0 | Booked into<br>clinic 0 🟠 | 0.0 | 405.0 | 0.0 | [███░░░░░░░░░░░░░░░░░] 74 | 1.0 | 204.0 | 204 (+74) |
| 3 | NaN | BAR0 | NaN | queue | appointment_booked_waiting_0 | NaN | 63 | NaN | NaN | NaN | ... | 870.0 | 505.0 | Booked into<br>clinic 0 🟠 | 0.0 | 405.0 | 0.0 | [███░░░░░░░░░░░░░░░░░] 73 | 1.0 | 277.0 | 277 (+73) |
| 4 | NaN | BAR0 | NaN | queue | appointment_booked_waiting_0 | NaN | 64 | NaN | NaN | NaN | ... | 870.0 | 505.0 | Booked into<br>clinic 0 🟠 | 0.0 | 405.0 | 0.0 | [███░░░░░░░░░░░░░░░░░] 73 | 1.0 | 350.0 | 350 (+73) |
| ... | ... | ... | ... | ... | ... | ... | ... | ... | ... | ... | ... | ... | ... | ... | ... | ... | ... | ... | ... | ... | ... |
| 905 | NaN | BAR9 | NaN | queue | appointment_booked_waiting_8 | NaN | 146 | NaN | NaN | NaN | ... | 230.0 | 505.0 | Booked into<br>clinic 8 🔶 | 8.0 | 405.0 | 0.0 | [████████░░░░░░░░░░░░] 190 | 1.0 | 11567.0 | 11567 (+190) |
| 906 | NaN | BAR9 | NaN | queue | appointment_booked_waiting_8 | NaN | 147 | NaN | NaN | NaN | ... | 230.0 | 505.0 | Booked into<br>clinic 8 🔶 | 8.0 | 405.0 | 0.0 | [████████░░░░░░░░░░░░] 189 | 1.0 | 11756.0 | 11756 (+189) |
| 907 | NaN | BAR9 | NaN | queue | appointment_booked_waiting_8 | NaN | 148 | NaN | NaN | NaN | ... | 230.0 | 505.0 | Booked into<br>clinic 8 🔶 | 8.0 | 405.0 | 0.0 | [████████░░░░░░░░░░░░] 186 | 1.0 | 11942.0 | 11942 (+186) |
| 908 | NaN | BAR9 | NaN | queue | appointment_booked_waiting_8 | NaN | 149 | NaN | NaN | NaN | ... | 230.0 | 505.0 | Booked into<br>clinic 8 🔶 | 8.0 | 405.0 | 0.0 | [████████░░░░░░░░░░░░] 186 | 1.0 | 12128.0 | 12128 (+186) |
| 909 | NaN | BAR9 | NaN | queue | appointment_booked_waiting_8 | NaN | 150 | NaN | NaN | NaN | ... | 230.0 | 505.0 | Booked into<br>clinic 8 🔶 | 8.0 | 405.0 | 0.0 | [████████░░░░░░░░░░░░] 186 | 1.0 | 12314.0 | 12314 (+186) |
1001 rows × 23 columns
With this done, we can generate our animation!
generate_animation(
full_entity_df_plus_pos=full_df_plus_pos,
event_position_df=event_position_df,
scenario=None,
plotly_height=800,
plotly_width=1000,
override_x_max=1000,
override_y_max=1000,
entity_icon_size=10,
text_size=10,
include_play_button=True,
add_background_image=None,
display_stage_labels=True,
time_display_units="d",
simulation_time_unit="days",
start_date="2022-06-27",
setup_mode=False,
frame_duration=1500, #milliseconds
frame_transition_duration=1000, #milliseconds
debug_mode=False
)Note that the flow of the patients to their actual appointments is somewhat unintuitive. One simple option is to remove the play button option, which means users can only scrub. This removes any frame interpolation, leading to a more interpretable plot.
generate_animation(
full_entity_df_plus_pos=full_df_plus_pos,
event_position_df=event_position_df,
scenario=None,
plotly_height=800,
plotly_width=1000,
override_x_max=1000,
override_y_max=1000,
entity_icon_size=10,
text_size=10,
include_play_button=False, # CHANGED
add_background_image=None,
display_stage_labels=True,
time_display_units="d",
simulation_time_unit="days",
start_date="2022-06-27",
setup_mode=False,
# frame_duration=1500, #milliseconds
# frame_transition_duration=1000, #milliseconds
debug_mode=False
)Error changing frame duration
Error changing frame transition durationWe can achieve something similar while not losing the play button by turning the play button back on and setting the frame transition duration to 0.
generate_animation(
full_entity_df_plus_pos=full_df_plus_pos,
event_position_df=event_position_df,
scenario=None,
plotly_height=800,
plotly_width=1000,
override_x_max=1000,
override_y_max=1000,
entity_icon_size=10,
text_size=10,
include_play_button=True,
add_background_image=None,
display_stage_labels=True,
time_display_units="d",
simulation_time_unit="days",
start_date="2022-06-27",
setup_mode=False,
frame_duration=1500, #milliseconds
frame_transition_duration=0, #milliseconds # CHANGED
debug_mode=False
)Now, in this particular example, it perhaps doesn’t feel like we’re getting a huge amount more information than we would from any old animated bar chart.
So let’s add the final LOS of each individual at the point they attend the clinic, and whether they were a priority patient.
def show_priority_icon(row):
if "have_appointment" in row["event"]:
if int(row["pathway"]) == 2:
return "🚨"
else:
return row["icon"]
else:
return row["icon"]
def add_los_to_icon(row):
if "have_appointment" in row["event"]:
return f'{row["icon"]}<br>{int(row["wait"])}'
else:
return row["icon"]full_df_plus_pos = full_df_plus_pos.assign(
icon=full_df_plus_pos.apply(show_priority_icon, axis=1)
)
full_df_plus_pos = full_df_plus_pos.assign(
icon=full_df_plus_pos.apply(add_los_to_icon, axis=1)
)generate_animation(
full_entity_df_plus_pos=full_df_plus_pos,
event_position_df=event_position_df,
scenario=None,
plotly_height=800,
plotly_width=1200,
override_x_max=1000,
override_y_max=1000,
entity_icon_size=10,
text_size=10,
include_play_button=True,
add_background_image=None,
display_stage_labels=True,
time_display_units="d",
simulation_time_unit="days",
start_date="2022-06-27",
setup_mode=False,
frame_duration=1000, #milliseconds
frame_transition_duration=0, #milliseconds # CHANGED
debug_mode=False
)Values below the individuals show the wait time in days.
Priority patients are identified with a 🚨 symbol. These patients will be moved to the front of the booking queue.
Exploring experimental alternative 1: Replacing ‘x more’ with ascii count bar
def ascii_queue_icon(icon, count, max_count, bar_length=10, filled_char="█", empty_char="░", count_only=False):
"""
Returns an ASCII progress bar string representing the queue length.
Args:
icon (str): The current icon
count (int): The current patient count.
max_count (int): The maximum patient count in the data.
bar_length (int): Total length of the bar in characters.
filled_char (str): Character to use for filled segments.
empty_char (str): Character to use for empty segments.
Returns:
str: ASCII progress bar string.
"""
if max_count == 0:
return empty_char * bar_length # avoid division by zero
if not np.isnan(count):
if count_only:
return f"{count:.0f}"
else:
if "more" in icon:
filled_len = int(round(bar_length * count / max_count))
bar = filled_char * filled_len + empty_char * (bar_length - filled_len)
return f"[{bar}] + {count:.0f} more"
else:
return icon
else:
return ""event_log_df = pd.read_csv("as-is.csv")
full_patient_df = reshape_for_animations(
event_log_df,
entity_col_name="patient",
limit_duration=WARM_UP+RESULTS_COLLECTION,
every_x_time_units=1,
step_snapshot_max=10,
)
# Remove the warm-up period from the event log
full_patient_df = full_patient_df[full_patient_df["snapshot_time"] >= WARM_UP]
event_position_df = pd.read_csv("as-is_event_position_df.csv")
event_position_df['x'] = event_position_df.apply(
lambda row: row['x'] - 70
if "appointment_booked_waiting" in row['event']
else row['x'], # fallback to original value
axis=1
)
full_df_plus_pos = generate_animation_df(
full_entity_df=full_patient_df,
entity_col_name="patient",
event_position_df=event_position_df,
wrap_queues_at=10,
step_snapshot_max=50,
gap_between_entities=15,
gap_between_queue_rows=20,
debug_mode=True
)
full_df_plus_pos['patient_count'] = full_df_plus_pos.apply(
lambda row: int(re.search(r'\d+', row['icon'])[0])
if "more" in row['icon']
else 0,
axis=1
)
max_count = max(full_df_plus_pos['patient_count'])Placement dataframe started construction at 16:36:54
Placement dataframe finished construction at 16:36:54# Update the icon column conditionally
full_df_plus_pos['icon'] = full_df_plus_pos.apply(
lambda row: ascii_queue_icon(row['icon'], row['patient_count'], max_count, 10)
if "appointment_booked_waiting" in row['event']
else row['icon'], # fallback to original value
axis=1
)
# Also move the icon over a bit
full_df_plus_pos['x_final'] = full_df_plus_pos.apply(
lambda row: row['x_final'] - 100
if "appointment_booked_waiting" in row['event']
else row['x_final'], # fallback to original value
axis=1
)generate_animation(
full_entity_df_plus_pos=full_df_plus_pos,
event_position_df=event_position_df,
entity_col_name="patient",
scenario=None,
plotly_height=1000,
plotly_width=1000,
override_x_max=1000,
override_y_max=1000,
entity_icon_size=10,
text_size=10,
include_play_button=True,
add_background_image=None,
display_stage_labels=True,
time_display_units="d",
simulation_time_unit="days",
start_date="2022-06-27",
setup_mode=False,
frame_duration=1500, #milliseconds
frame_transition_duration=1000, #milliseconds
debug_mode=False
)Let’s again try setting our frame duration to 0.
generate_animation(
full_entity_df_plus_pos=full_df_plus_pos,
event_position_df=event_position_df,
entity_col_name="patient",
scenario=None,
plotly_height=1000,
plotly_width=1000,
override_x_max=1000,
override_y_max=1000,
entity_icon_size=10,
text_size=10,
include_play_button=True,
add_background_image=None,
display_stage_labels=True,
time_display_units="d",
simulation_time_unit="days",
start_date="2022-06-27",
setup_mode=False,
frame_duration=1500, #milliseconds
frame_transition_duration=30, #milliseconds
debug_mode=False
)